El Niño’s little brother
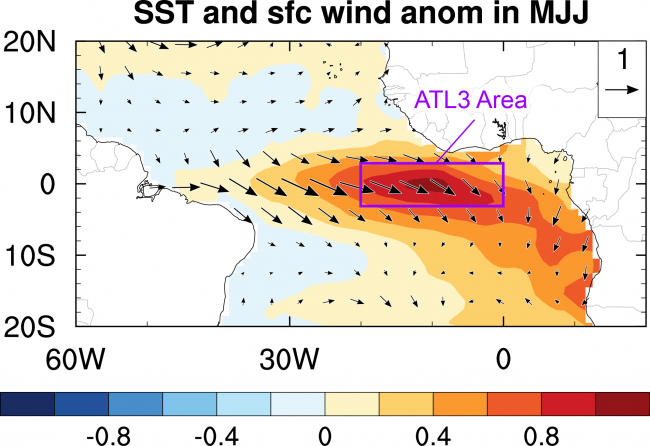
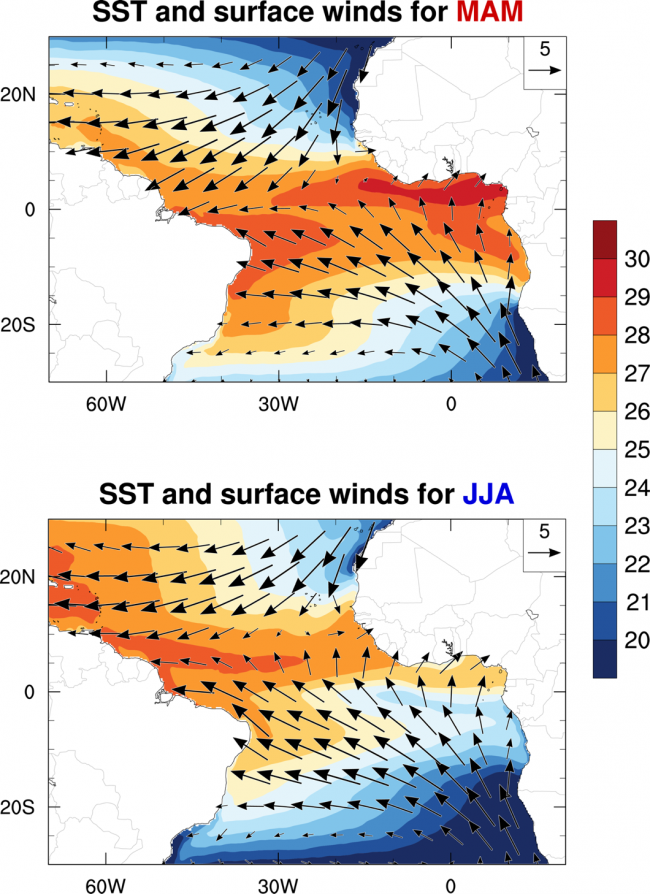
The Atlantic Niño is often regarded as something like the little brother of El Niño. During Pacific El Niño events, sea-surface temperatures (SSTs) in the central and eastern equatorial Pacific become warmer than average. In very much the same manner, SSTs in the central and eastern equatorial Atlantic become warmer than average (or anomalously warm) during Atlantic Niño events (Fig. 1). Saying something like “warmer than average” implies that we have a good understanding of what average conditions look like. These average conditions (also called climatology) are easy enough to calculate from observations so let’s take a closer look at them (Fig. 2).
Seasons in the equatorial Atlantic
While we mostly associate seasons with mid and higher latitudes, the tropics, too, can be subject to them, albeit in a somewhat different fashion. For the tropical Atlantic it is particularly interesting to look at spring (the average over March, April and May, often abbreviated to MAM; upper panel in Fig. 2) and summer (the average over June, July and August, or JJA; lower panel in Fig. 2). During spring, the sun is closest to the equator and so heating by solar radiation is strongest. This is one of the reasons why the equatorial SSTs are very warm during this season (it is actually more interesting than that but let’s not get into those details here). SSTs reach up to 29ºC in the Gulf of Guinea (roughly the region south of the West African protrusion extending to the equator) and are above 27 ºC across the basin from 10ºS to 5ºN. The picture looks quite different in summer. An area of relatively cool SST (below 25ºC) extends from the equatorial African coast to about 20ºW. This area is called the Atlantic cold tongue. The western equatorial Atlantic, on the other hand, stays relatively warm, and so we have a strong east-west difference (or gradient) in SST.
Atlantic Niños in a nutshell
In some years, the cold tongue formation in summer is weak, leading to warm SST anomalies in the cold tongue region. This is what is called an Atlantic Niño. One way to gauge the strength of these events is to calculate the area average of SST in the cold tongue region, defined as 20 ºW to 0 and 3 ºS to 3 ºN (see Fig. 1). This is called the ATL3 index. From the climatology above (Fig. 2) one can see that, depending on the season, the exact same absolute temperature can be associated with very different anomalies. A temperature of 28 ºC would be a cool anomaly in MAM but a very warm anomaly in JJA.
Coupling between SSTs and surface winds
Coming back to our Pacific-Atlantic comparison, I said the SST patterns look quite similar during warm events. But it is not only the SST patterns that suggest similarity, it is also the mechanisms leading to those events that are thought to be similar. Without going into too much detail here, both “Niños” are thought to depend on strong coupling between the ocean and atmosphere. When the ocean warms in the center of the basin it affects the atmosphere in such a way as to weaken the surface winds to the west. Weaker equatorial surface winds, on the other hand, change the ocean circulation in such a way as to warm the SST. And so, the whole thing escalates (warmer SSTs lead to weaker winds, weaker winds lead to warmer SSTs etc. etc.) until you have a full-fledged Niño on your hands. This is called a coupled feedback loop. (Of course, eventually, something will have to break this feedback or else temperatures would increase indefinitely.) The link between surface winds and SSTs is evident in Fig. 1, where there are warm SST anomalies in the central equatorial Atlantic, and westerly wind anomalies (i.e. weakening of the climatological easterly winds) in the west. In fact, the link between equatorial SST and surface winds can already be seen in the climatology (Fig. 2): during MAM, the east-west SST gradient is weak and so are the easterly surface winds. In JJA, on the other hand, both the SST gradient and surface winds are strong.
Some important differences between Atlantic and Pacific Niños
While it is nice to see some similarities between the Pacific and Atlantic, one should not forget the differences between them.
1) Geographical extent of SST anomalies
The warm SST patch in the Atlantic is about one third of its Pacific counterpart (at least in terms of width, that is, longitudinal extent); which might not be that surprising when you consider that the equatorial Atlantic basin is also just about one third of the Pacific.
2) Amplitude of SST anomalies
SSTs during major El Niño events can be up to +3 ºC warmer than average. In contrast, the Atlantic Niño usually does not exceed +1 ºC. So I think this makes it clear why the Atlantic Niño should be considered El Niño’s little brother. And, as we all know, once a little brother always a little brother. But not so fast. Even if the Atlantic Niño is relatively small in terms of area and amplitude, it has long been known that it exerts an important influence on the West African monsoon. Moreover, recent studies suggest that the Atlantic Niño may have a remote impact on the Pacific El Niño in some years (e.g. Rodriguez-Fonseca et al. 2009; Ding et al. 2012; Sasaki et al. 2014).
3) Strength of ocean-atmosphere coupling
The coupling between the atmosphere and ocean is thought to be weaker in the Atlantic (this has been discussed in some papers including: Zebiak 1993; and Richter et al. 2014). That is to say, the same SST anomaly will generate a weaker surface wind response in the Atlantic than in the Pacific. This is probably one of the reasons why the Atlantic Niño is relatively weak.
4) Timing of events
While El Niño usually peaks in northern hemisphere winter, the Atlantic Niño peaks in summer.
References
Ding, H., N. S. Keenlyside, and M. Latif, 2012: Impact of the equatorial Atlantic on the El Niño–Southern Oscillation. Climate Dyn., 38, 1965–1972, doi:https://doi.org/10.1007/s00382-011-1097-y.
Richter, I., S. K. Behera, T. Doi, B. Taguchi, Y. Masumoto, and S.-P. Xie, 2014: What controls equatorial Atlantic winds in boreal spring? Clim. Dyn., 43, 3091-3104. doi: 10.1007/s00382-014-2170-0
Rodríguez-Fonseca, B., I. Polo, J. García-Serrano, T. Losada, E. Mohino, C. R. Mechoso, and F. Kucharski, 2009: Are Atlantic Niños enhancing Pacific ENSO events in recent decades? Geophys. Res. Lett., 36, L20705, doi:https://doi.org/10.1029/2009GL040048.
Sasaki, W., T. Doi, K. J. Richards, and Y. Masumoto, 2014: Impact of the equatorial Atlantic sea surface temperature on the tropical Pacific in a CGCM. Climate Dyn., 43, 2539–2552, doi:https://doi.org/10.1007/s00382-014-2072-1.
Zebiak, S. E., 1993: Air–sea interaction in the equatorial Atlantic region. J. Climate, 6, 1567–1586.