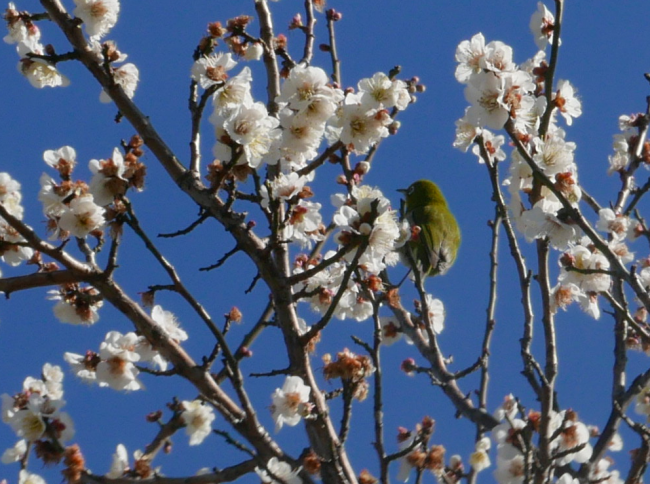

The Kanto region has seen a succession of clear days since January. The plum trees are blooming vigorously and Japanese white-eye birds are enjoying their nectar (see photo). According to the JMA, January was warmer than average and the sun shine hours in western Japan very longer than usual (link to the Japanese website). If we keep going like this, the SINTEX-F forecast for winter may actually turn out to be right! We will check on this in the next Climate Watch post.
In this post we will look at the SINTEX-F prediction for spring (March through May). According to the SINTEX-F model, surface air temperature will be above normal in most parts of the world (though there are a few exceptions like Canada and Brazil). Rainfall is predicted to be above average in Brazil and southern Africa, and below average in Indonesia and Europe. Conditions in the tropical Pacific and Indian Ocean will be around average. This might not last very long though. Model predictions for summer (June through August) call for the development of both El Niño and a positive Indian Ocean Dipole (the only precedents to this in the observational record are 1997 and 2015). More about this in the following.
Air temperature and rain forecast for the period March through May
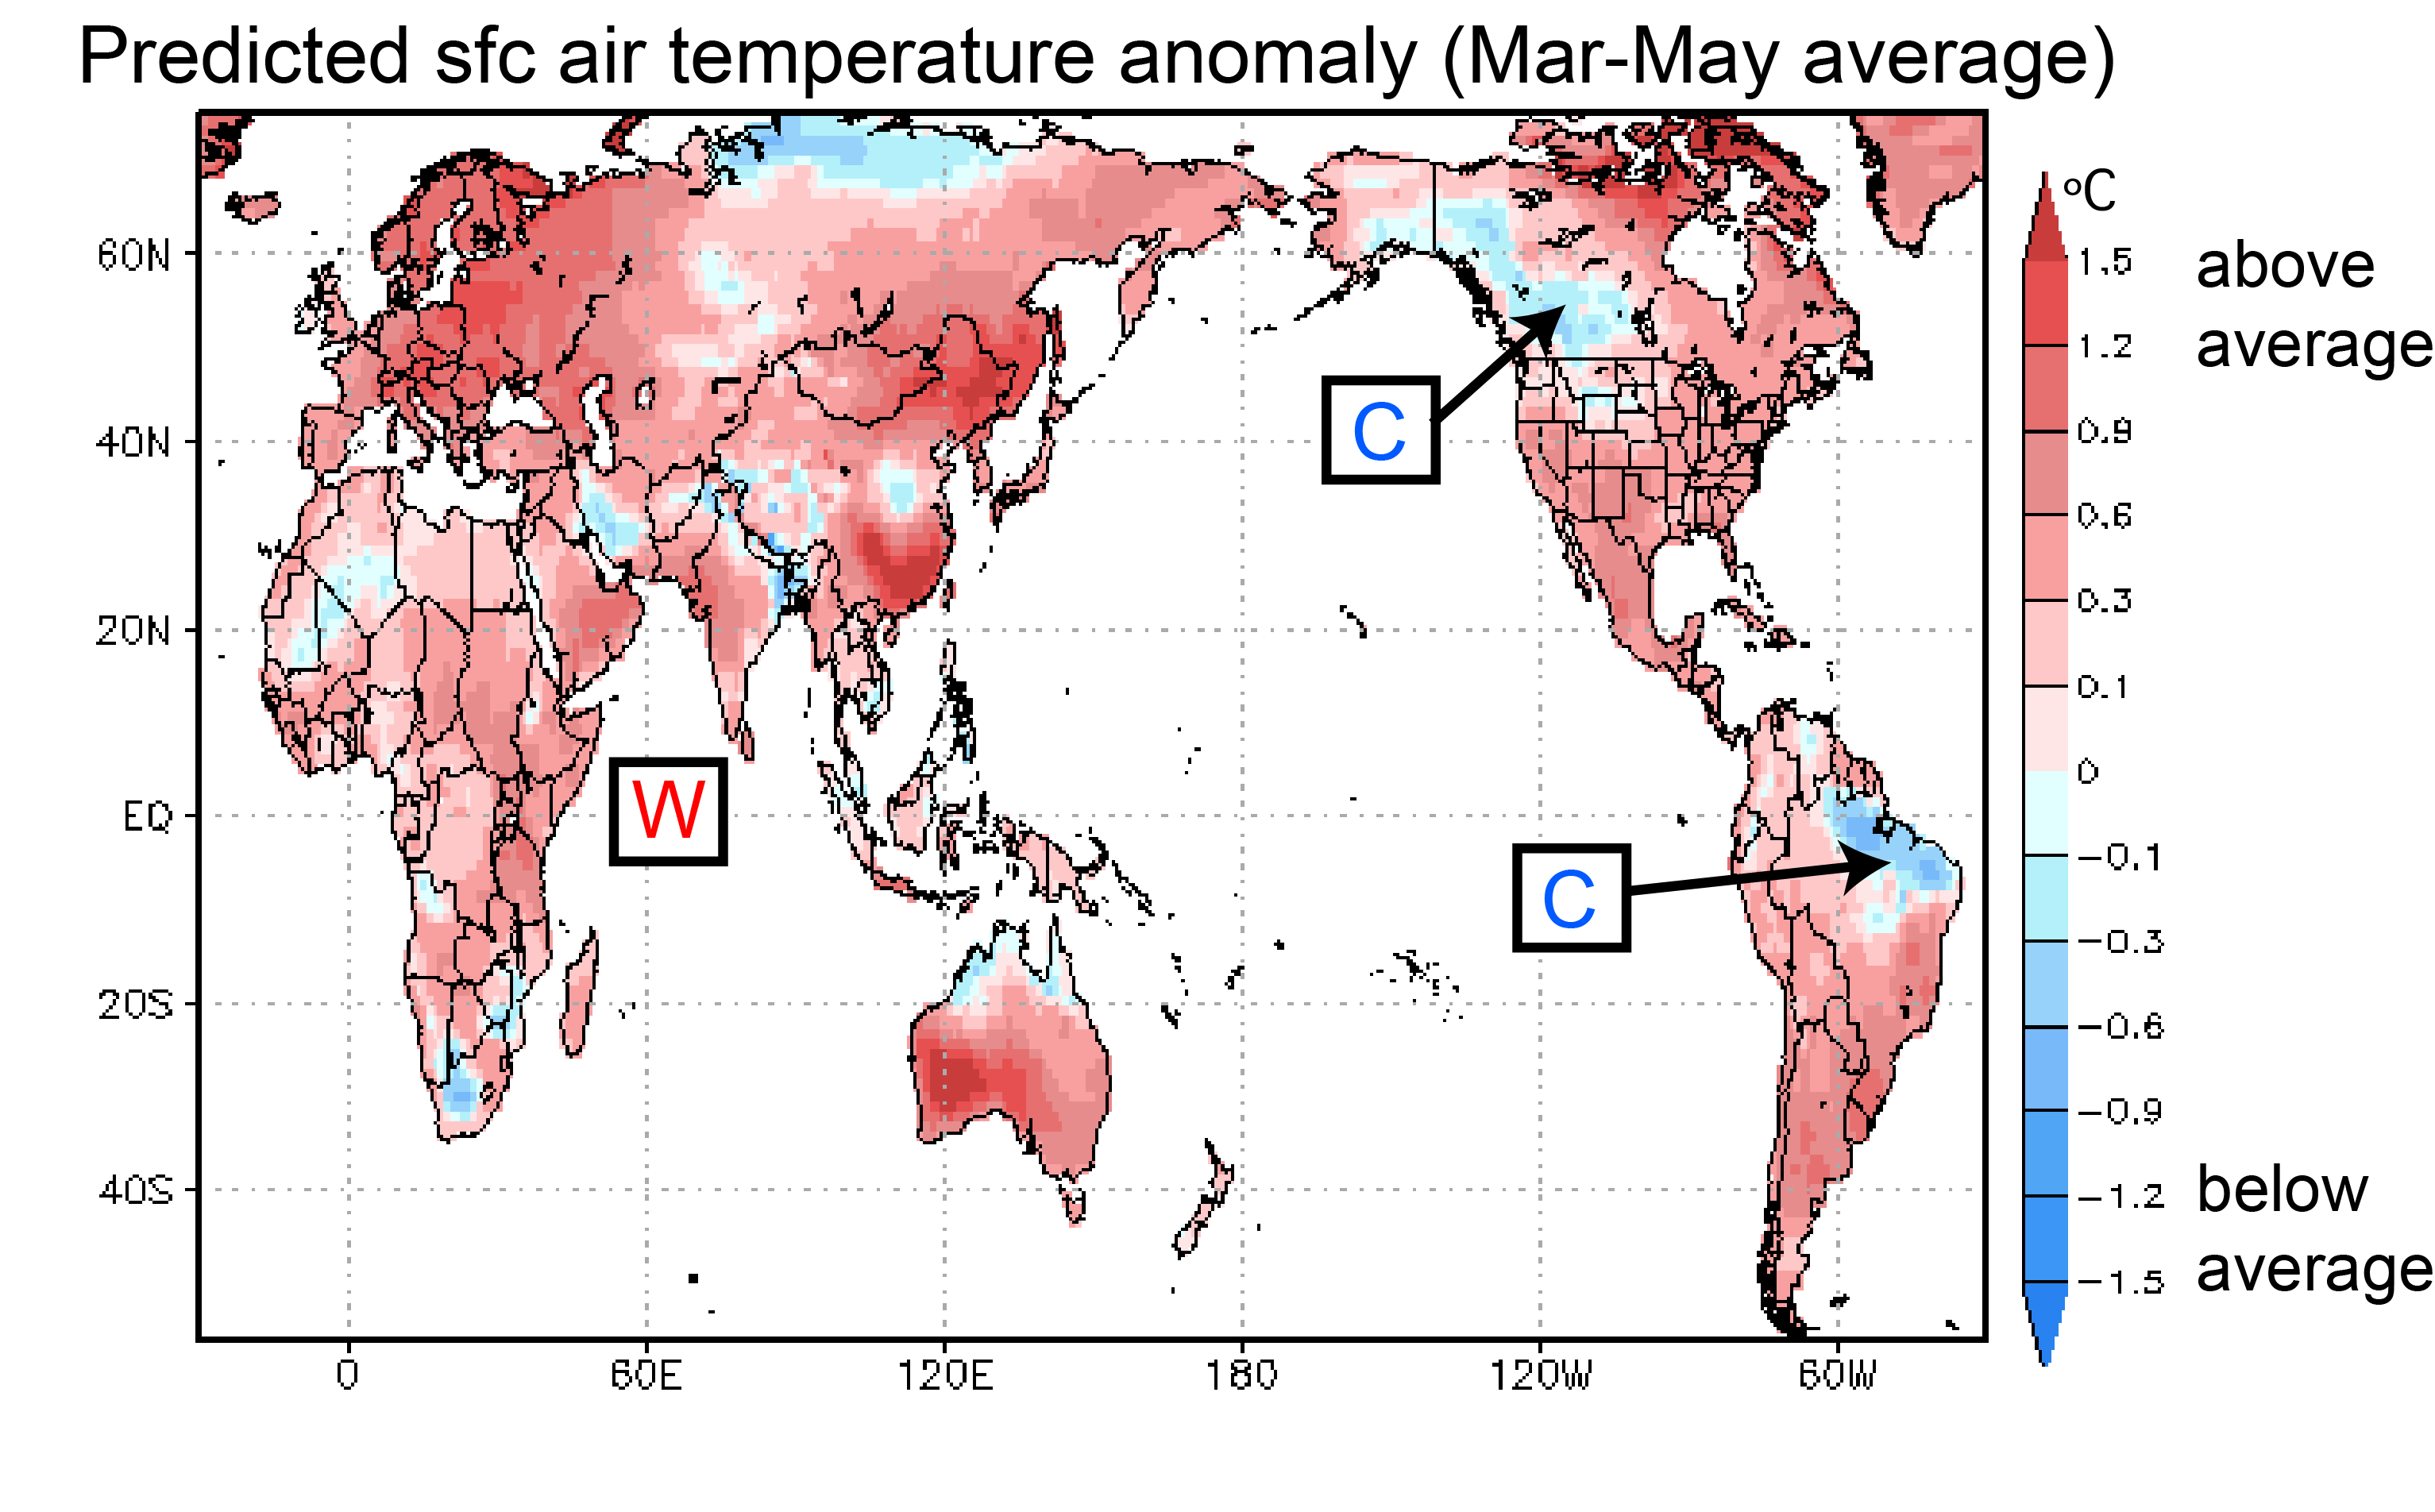
As stated above, surface air temperature will be above normal in most parts of the world with the exception of western Canada, northeast Brazil, and few more locations in the world.
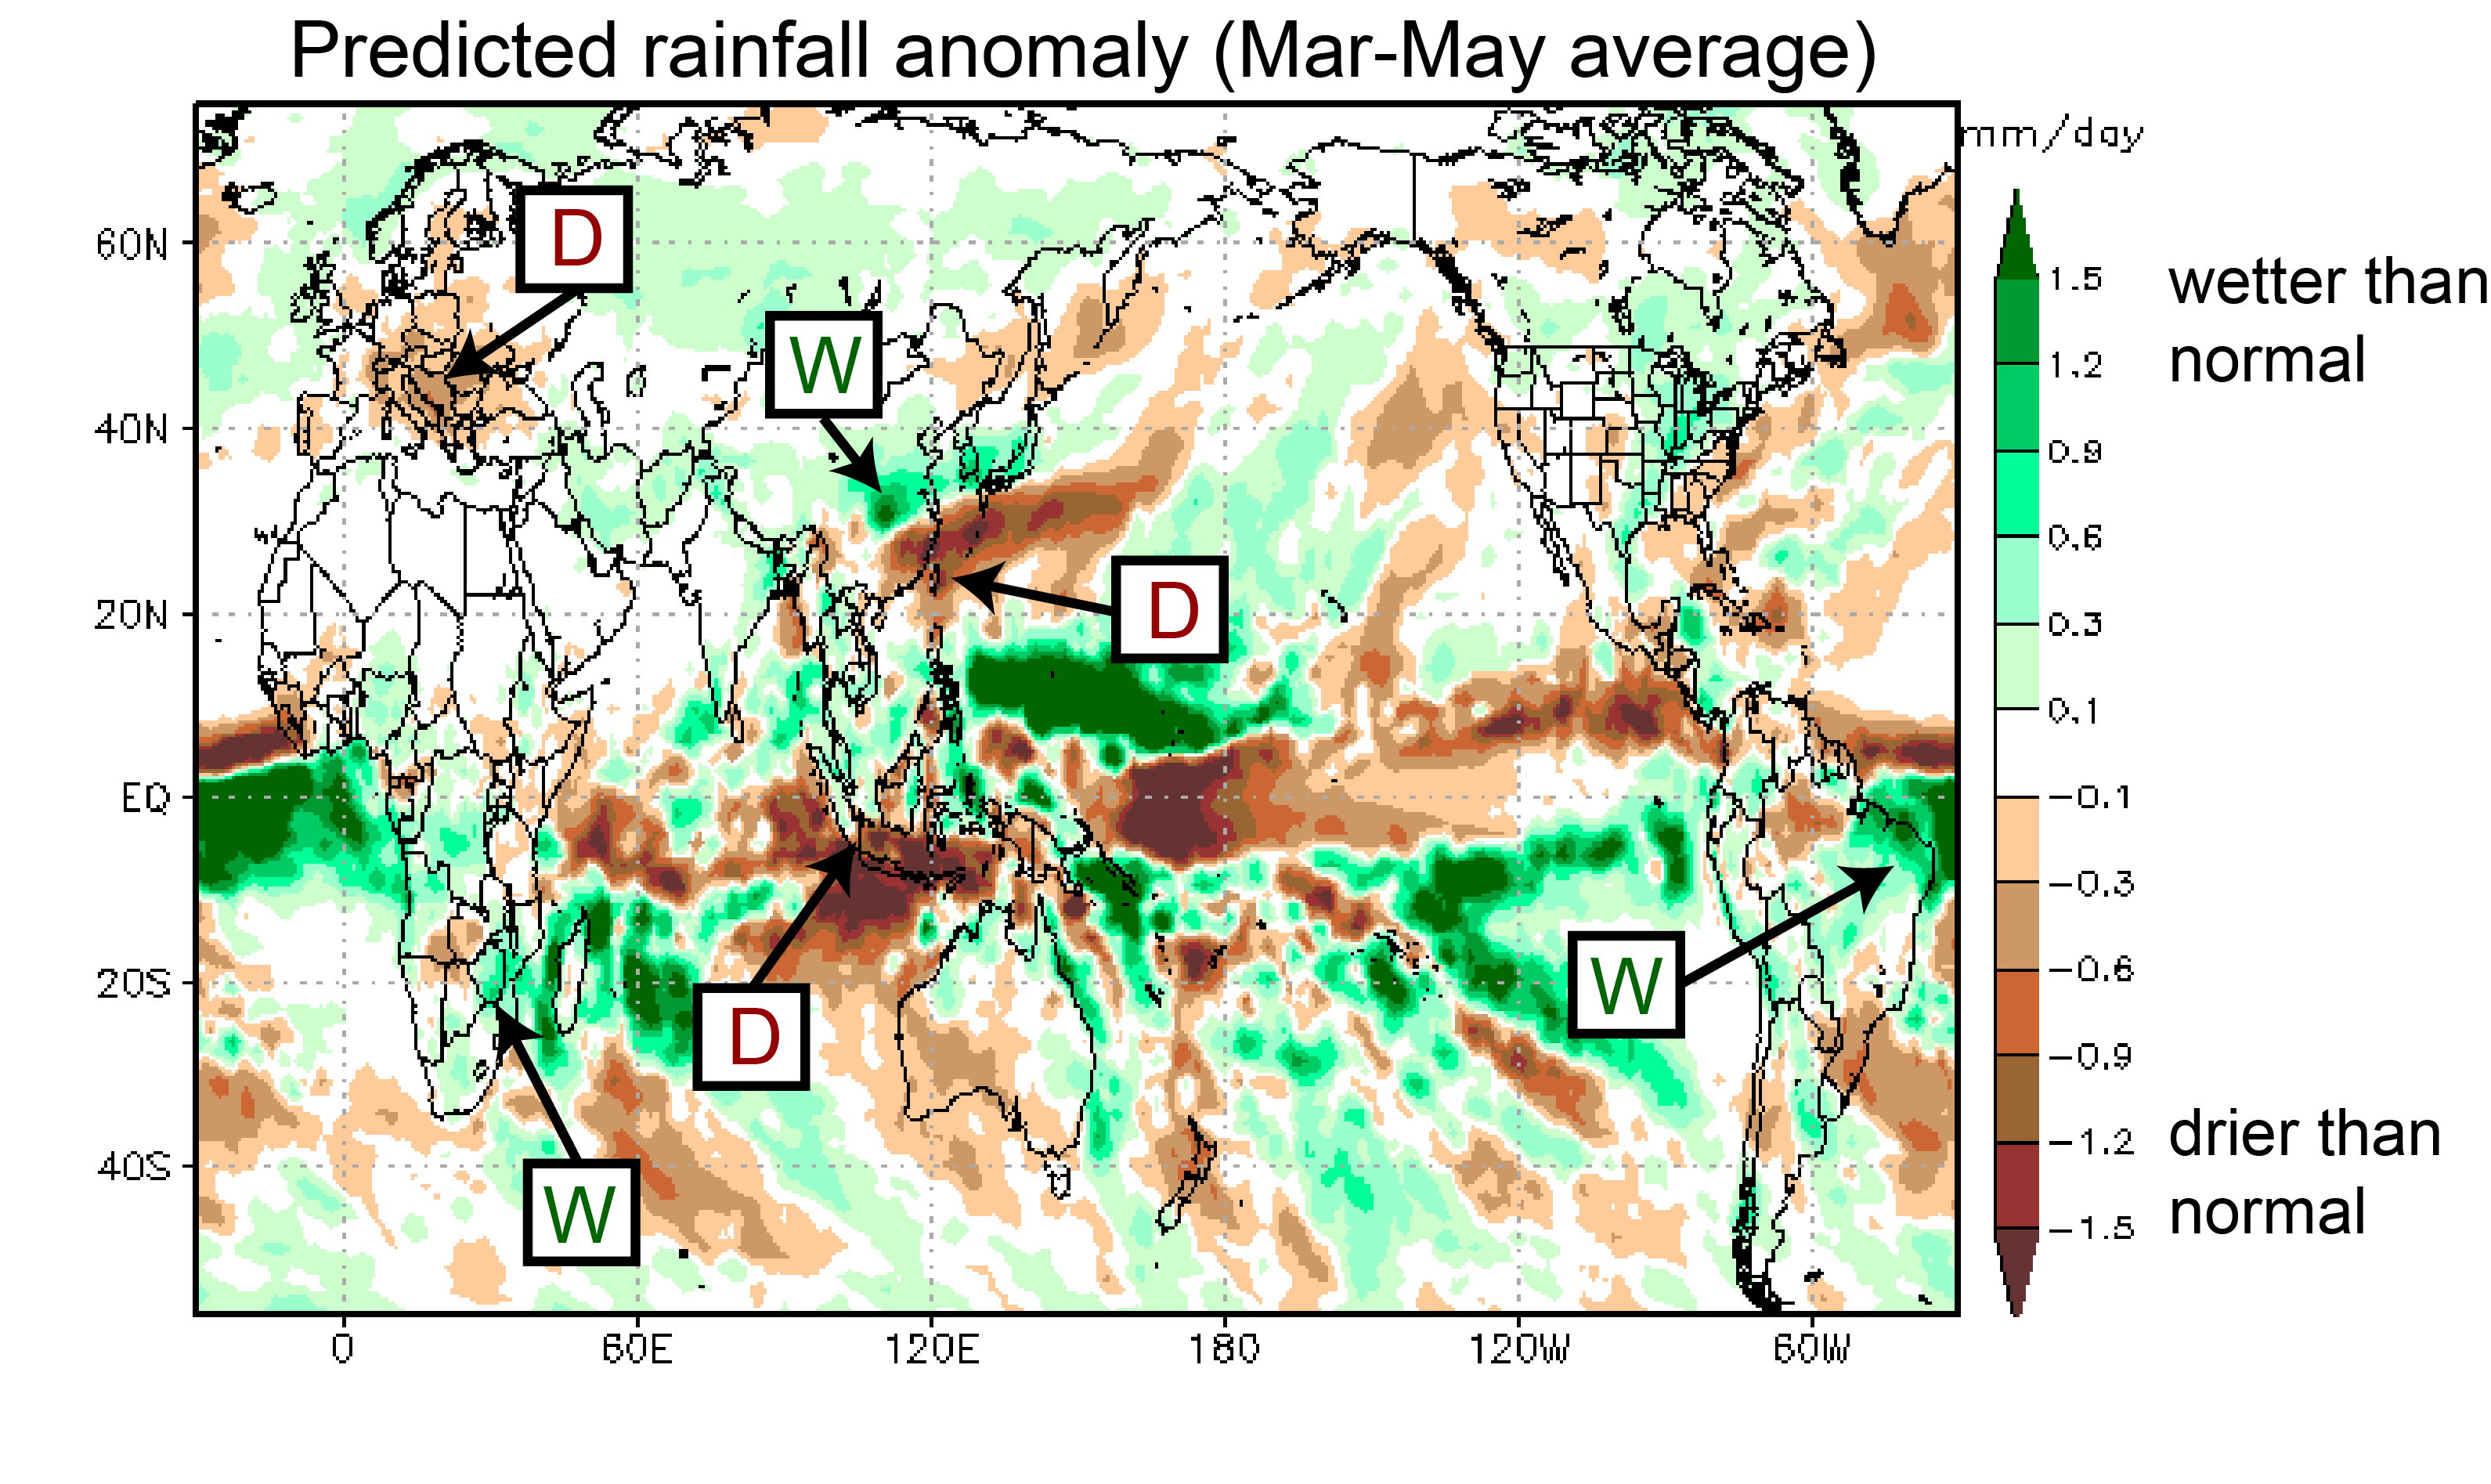
Rainfall is forecast to be above average in Brazil, eastern China, and southern Africa. Drier than average conditions are expected in southeastern China, Indonesia, and Europe.
For Japan, the model calls for a warm and wet spring (though, looking at individual months, it seems that March will be drier than usual). Please bear in mind though that the model’s forecast skill in the mid and high latitudes is limited.
Ocean temperatures for the period March through May
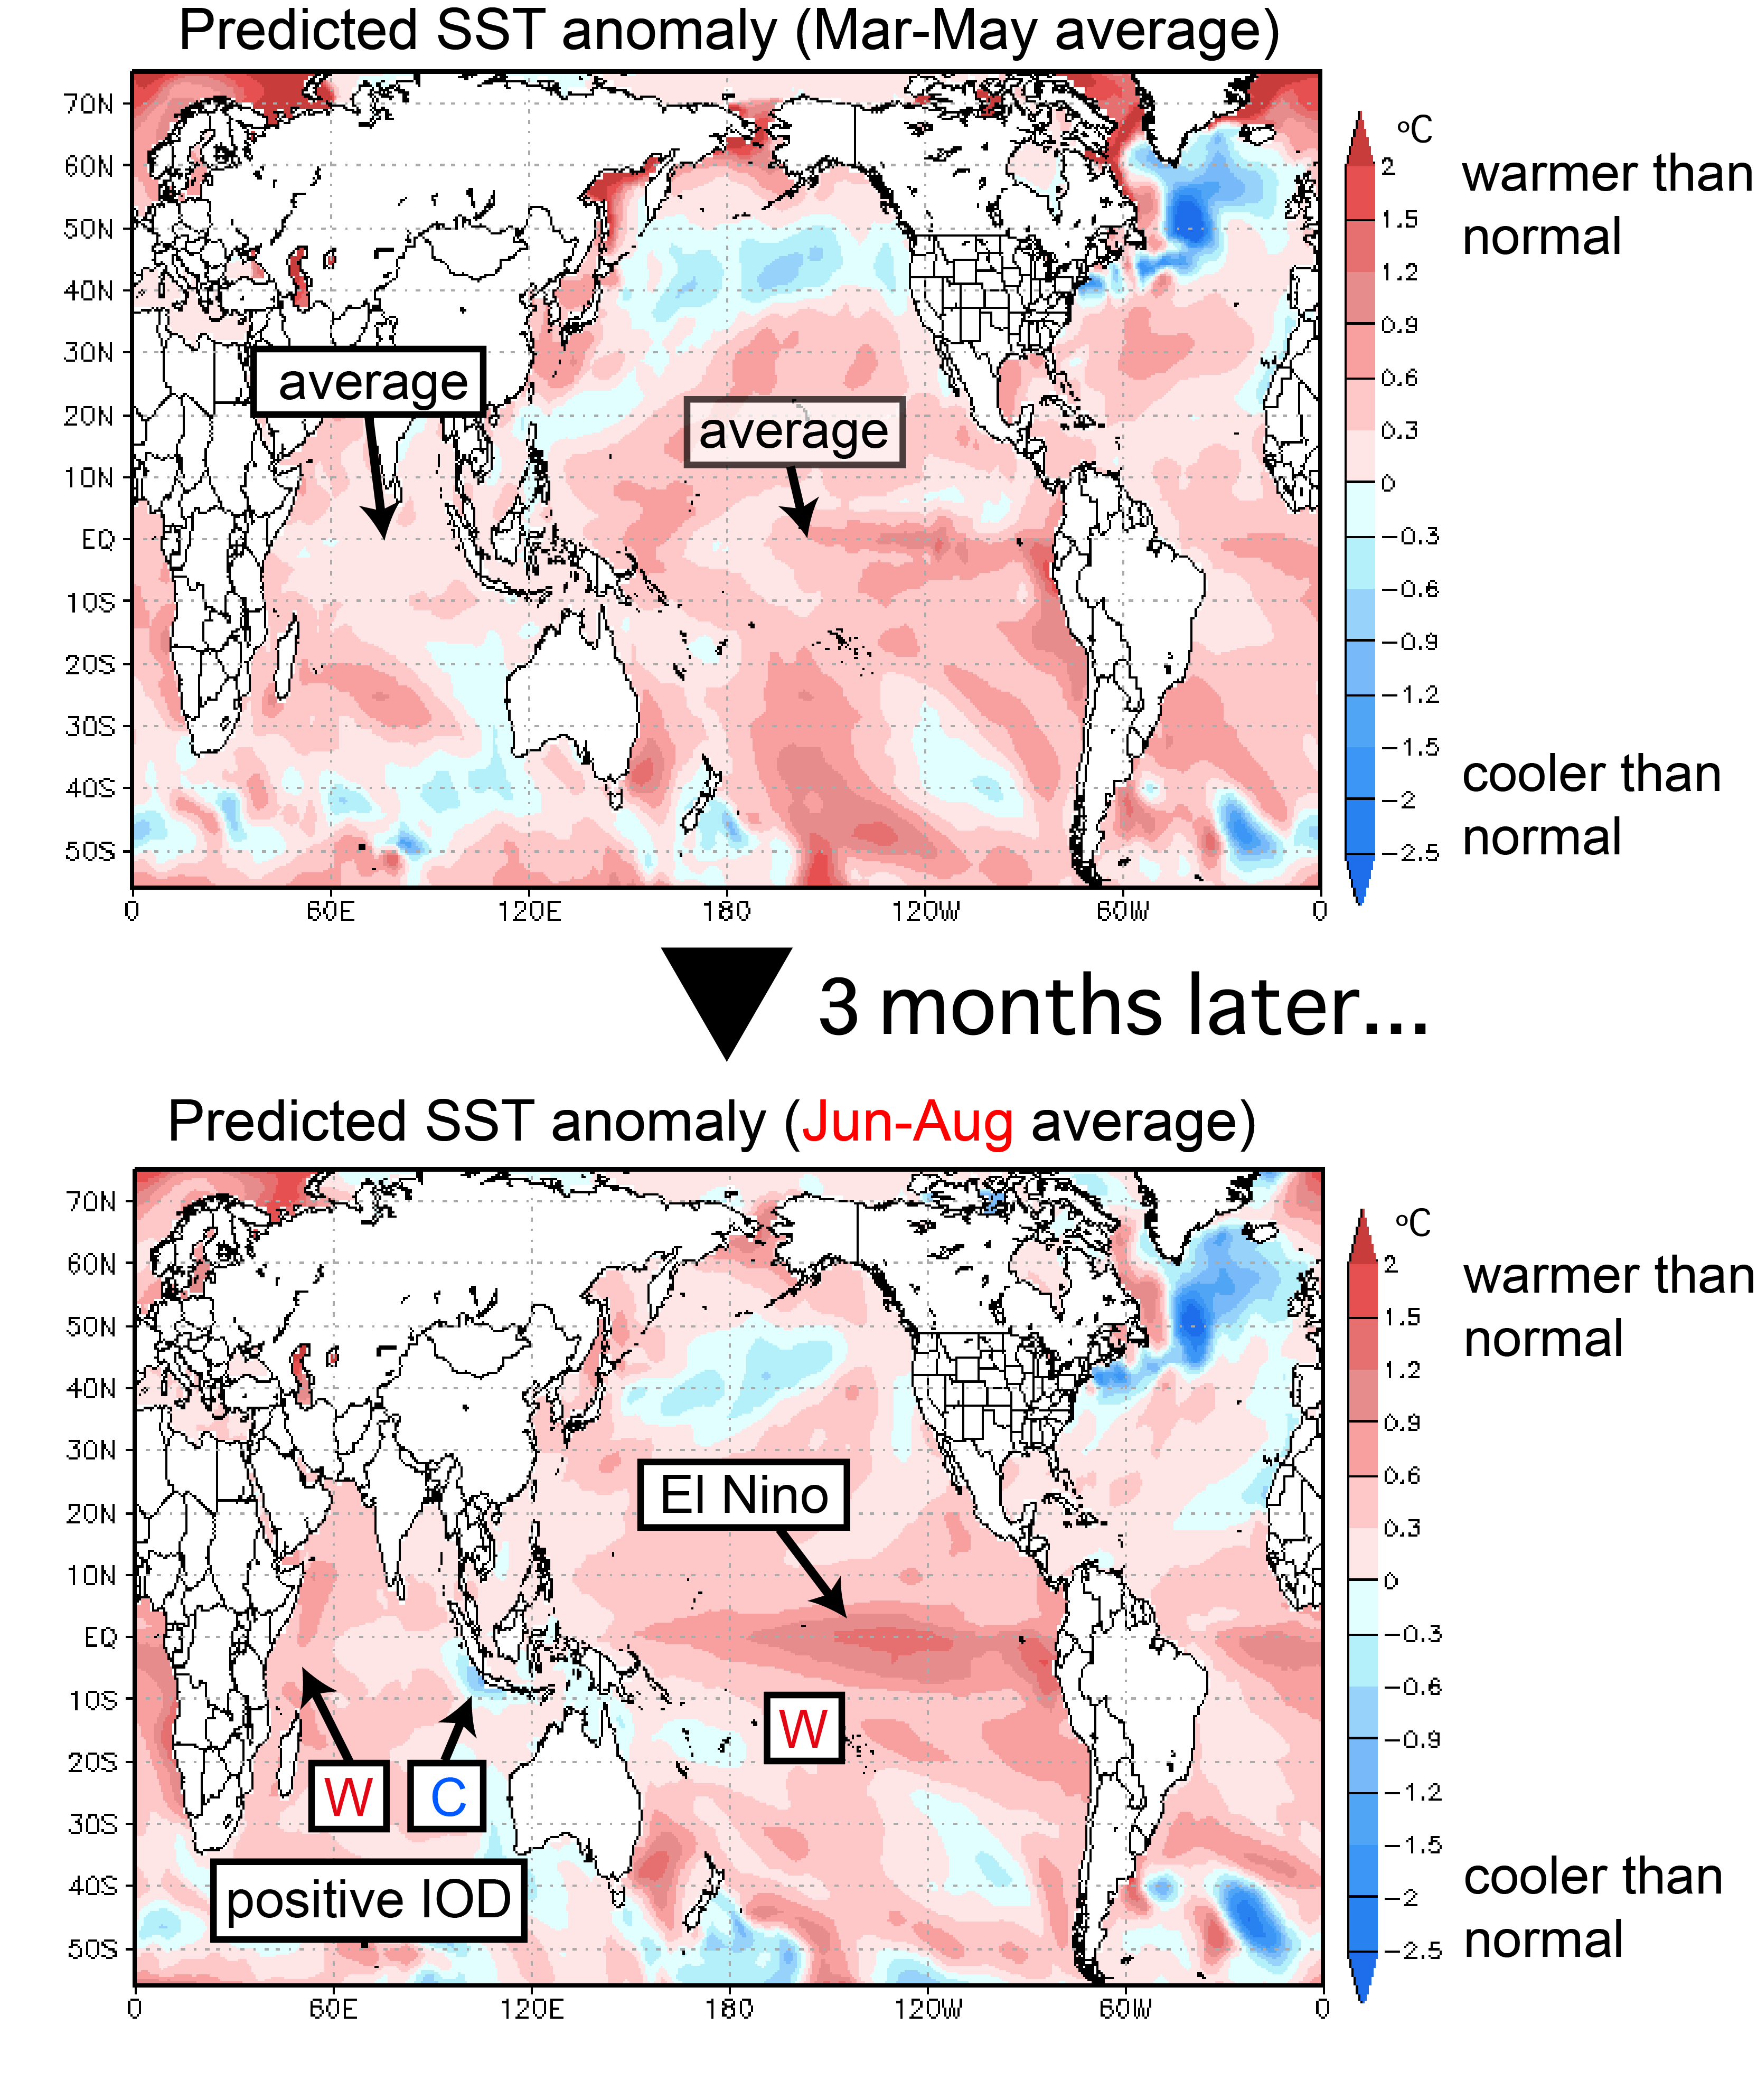
In difference to daily weather fluctuations, seasonal climate variations are strongly influenced by changes in sea-surface temperatures (SSTs). Particularly in the tropics, where the SSTs are warmer than in other regions, even small changes in temperature can produce far reaching effects.
According to the SINTEX-F prediction, the weak La Niña Modoki that developed last summer will terminate in spring, with conditions returning to average (Fig. 3). Likewise, the negative Indian Ocean Dipole that was present in summer and fall of last year will terminate as well and be replaced by close-to-average SST.
However, if we take a peek at the following season (June through August), it’s a completely different ball game (lower panel in Figure 3). SSTs in the central and eastern equatorial Pacific are predicted to warm up and, as you well know, that means El Niño. In the tropical Indian Ocean, on the other hand, SSTs are predicted to decrease in the east and increase in the west, a phenomenon known as the positive phase of the Indian Ocean Dipole.
The simultaneous occurrence of these two phenomena in summer might lead to a wide range of impacts worldwide. Here we focus on Japan, where this SST configuration is expected to lead to cooler than average temperatures in northern Japan, and warmer than average temperatures in western Japan. This pattern is also known as “cool north hot west” [translators note: this does not sound quite as pithy as the 4-Kanji Japanese original 北冷西暑 , “hoku rei sei sho” in romaji]. El Niño tends to weaken the Ogasawara High (a high pressure system southeast of Honshu Island), and this weakening tends to produce instability, rain, and cooler temperatures over northern Japan. Over western Japan, on the other hand, the positive Indian Ocean Dipole overrides El Niño’s influence and thus warmer than average temperatures dominate. A simultaneous El Niño and positive Indian Ocean Dipole have only been observed twice: in 1997 and in 2015.
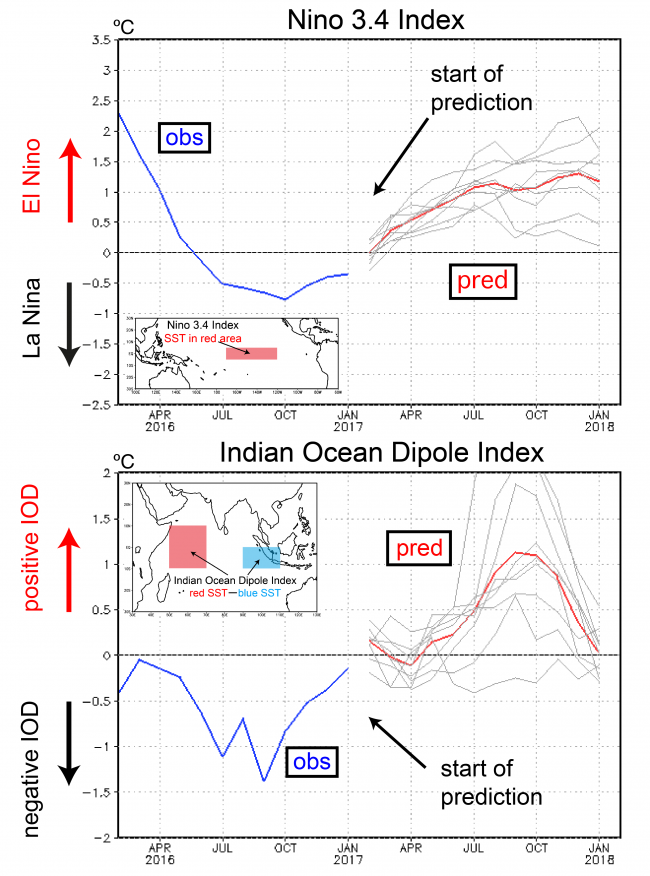
So how does this tale of two modes continue? Figure 4 shows the extended forecast for two indices of interest. The Niño 3.4 index is predicted to exceed +0.5 °C in April and +1 °C in July (red line in the upper panel of Fig. 4). As we mentioned before, if indeed another El Niño were to develop in 2017 it would likely put an end to the spell of La Niña-like conditions that have prevailed over the last 10 years or so. Instead, we might be entering a prolonged period of El Niño-like conditions. This would most certainly mean the end of the so-called “hiatus” in global warming and usher in a period of accelerated warming.
The IOD index will continue to hover around zero for a while but is predicted to exceed +0.5 °C in July and reach its peak in fall. Note, however, that the ensemble spread (grey lines in Fig. 4, lower panel) is very large, so it is still quite uncertain exactly how strong this event will be.
Both the El Niño/La Niña and the Indian Ocean Dipole have significant climatic impacts the world round. With both an El Niño and a positive Indian Ocean Dipole developing until summer, it seems that spring may be the calm before the storm. We’ll keep you posted.