
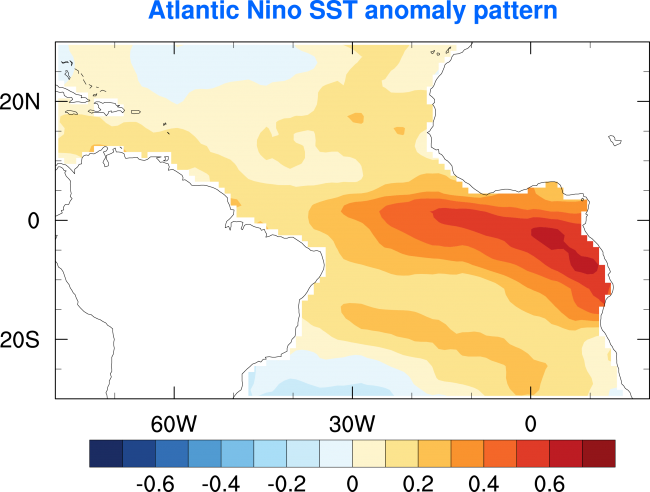
In this post I would like to focus on the current conditions in the equatorial Atlantic. Year-to-year sea-surface temperature (SST) variations in this region are dominated by the Atlantic Niño (also called the zonal mode of equatorial Atlantic variability). This is an SST pattern that resembles El Niño in the tropical Pacific and is characterized by warmer than average temperatures in the central and eastern equatorial Atlantic. When an Atlantic Niño occurs it usually leads to increased rainfall along the coast of West Africa and decreased rainfall in the interior (the Sahel region). For more on Atlantic Niños, please check here.
Equatorial Atlantic mood swings
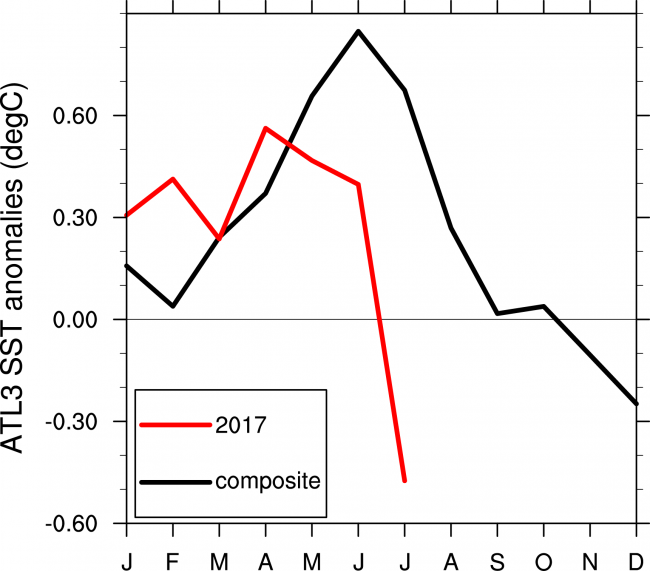
So what is the status of the equatorial Atlantic this year? Well, it’s complicated. Atlantic Niños typically peak in summer, which happens to be the current season. Thus, if there were any Atlantic Niño going on this year it should be showing up clearly by now, right? Let’s take a look at how the eastern equatorial Atlantic SST evolved in 2017 (Fig. 1). For this, we take SST anomalies averaged over the region 20 ºW-0, 3 ºS-3 ºN, the so-called ATL3 index. The index started out with +0.3 ºC in January. From March to April temperatures climbed considerably to almost +0.6 ºC, above the +0.5 ºC threshold (there are no official criteria for the Atlantic Niño, like there are for ENSO; so this is just my personal criterion). Thus, in April it looked like we were well on our way to an Atlantic Niño. In May, temperatures took a slight dip but it still looked like the event would eventually materialize. In June, however, temperatures dropped further. And, when this month temperatures plunged into the negative range it became clear that an Atlantic Niño was an unlikely prospect this year. On the other hand, one should be careful, because we are still in July and the data only reflect the first half of the month. Temperatures might at least partially recover; or they might dip even further and develop into a full-fledged Atlantic Niña. The last few days of observations would suggest that temperatures have recovered and are now around neutral. Thus the current extreme temperature swing is likely to be evened out once data for the whole month is in.
SSTs and surface winds in the equatorial Atlantic: a troubled couple
It is not only the pronounced temperature swings in the equatorial Atlantic that make this year remarkable. It is also how unconcerned the surface winds were by these SST antics. From October 2016 to June 2017 the east-west surface winds were consistently stronger than average (i.e. they were blowing more strongly from east to west, as shown by the westward pointing arrows in Fig. 2). A few selected months are shown in Fig. 2. Based on what we know about Atlantic Niños, we would expect cooler than average SSTs to prevail under these conditions. And yet, SSTs were actually warmer than average throughout this period. Perhaps even more perplexingly, in July, when the SST anomalies finally did conform to expectations and dipped below zero, the winds in the west of the basin suddenly became weaker than average (shown by the northeastward pointing arrows in Fig. 2). As noted before, however, data for July is not complete yet, so one shouldn’t read too much into this preliminary July average.
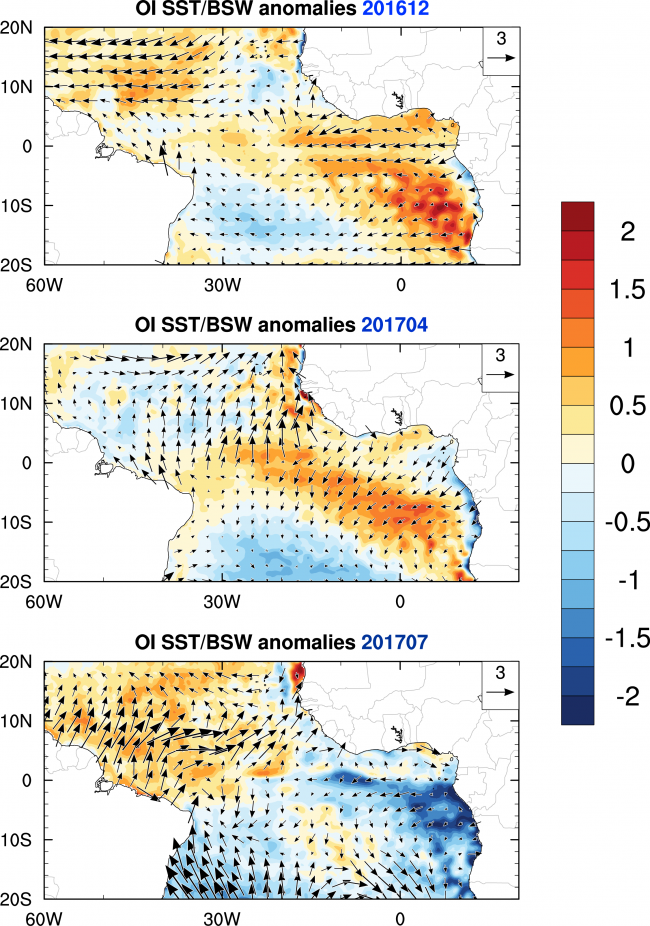
When the surface winds do pretty much their own thing, never minding about the SST (and vice versa), it indicates weak coupling between the atmosphere and ocean. In fact, it has long been suspected that the coupling in the equatorial Atlantic is much weaker than in the equatorial Pacific (a landmark paper by Stephen Zebiak in 1993 was perhaps one of the first to explicitly mention this; see also Richter et al. 2014). Several years back I and my coauthors published a paper showing that, in some years, equatorial Atlantic warming occurs despite stronger than average surface winds (Richter et al. 2012; see here for a simplified summary). We suggested that this had to do with warmer than average SST off the equator and with equatorial warming below the ocean surface (note that other explanations have been put forward, e.g. Lübbecke and McPhaden 2012). Careful analysis will be needed to understand whether this mechanism can explain the developments of 2017. But the warm SST anomalies just south and north of the equator (see e.g. April in Fig. 2) are indeed striking.
Outlook
Based on the vagaries of the equatorial Atlantic this year I’d rather not bet on any outcome. My best guess is that temperatures in the ATL3 will somewhat recover from the rapid decrease in early July but remain below average for the rest of this summer. I will report on the outcome of this cliff hanger once all the results are in, which should be early September. By that time, it may also be interesting to take a look at this year’s West African monsoon.
References
Lübbecke, J. F. and M. J. McPhaden, 2012: On the inconsistent relationship between Pacific and Atlantic Niños. J. Climate, 25 (12), pp. 4294-4303, doi: 10.1175/JCLI-D-11-00553.1
Richter, I., S. K. Behera, Y. Masumoto, B. Taguchi, H. Sasaki, and T. Yamagata, 2012: Multiple causes of interannual sea surface temperature variability in the equatorial Atlantic Ocean. Nature Geosci., doi: 10.1038/NGEO1660
Richter, I., S. K. Behera, T. Doi, B. Taguchi, Y. Masumoto, and S.-P. Xie, 2014: What controls equatorial Atlantic winds in boreal spring? Clim. Dyn., 43, 3091-3104. doi: 10.1007/s00382-014-2170-0
Zebiak, S. E., 1993: Air–sea interaction in the equatorial Atlantic region. J. Climate, 6, 1567–1586.