

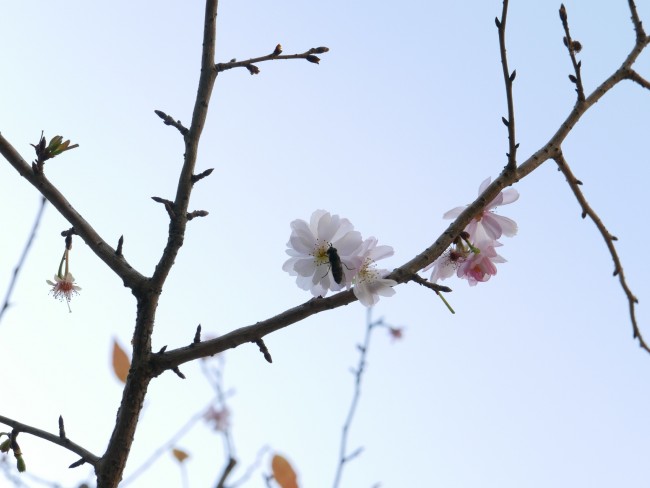
Winter has been off to a relatively slow start in Japan and so, even in mid-December, some October-Sakura (Japanese: juugatsu zakura or 十月桜) trees at the Yokohama campus were still in bloom. This Japanese cherry tree is named for its unusual habit of blossoming in October (whereas most cherry trees blossom in spring). If you look very closely, you can actually see a bee resting on the flower petals. Probably, it is preparing for winter, and so it might be interested in hearing the latest outlook for the season.
According to the SINTEX-F model, surface air temperature will be above normal in many parts of the world. In the tropics, the current La Niña Modoki will be weakening but continue through winter. The negative Indian Ocean Dipole will terminate soon, with conditions returning to average in the region. Water temperatures off northwestern Australia are expected to become warmer than average, a phenomenon known as Ningaloo Niño. Let’s take a closer look.
Air temperature and rain forecast for the period December through February
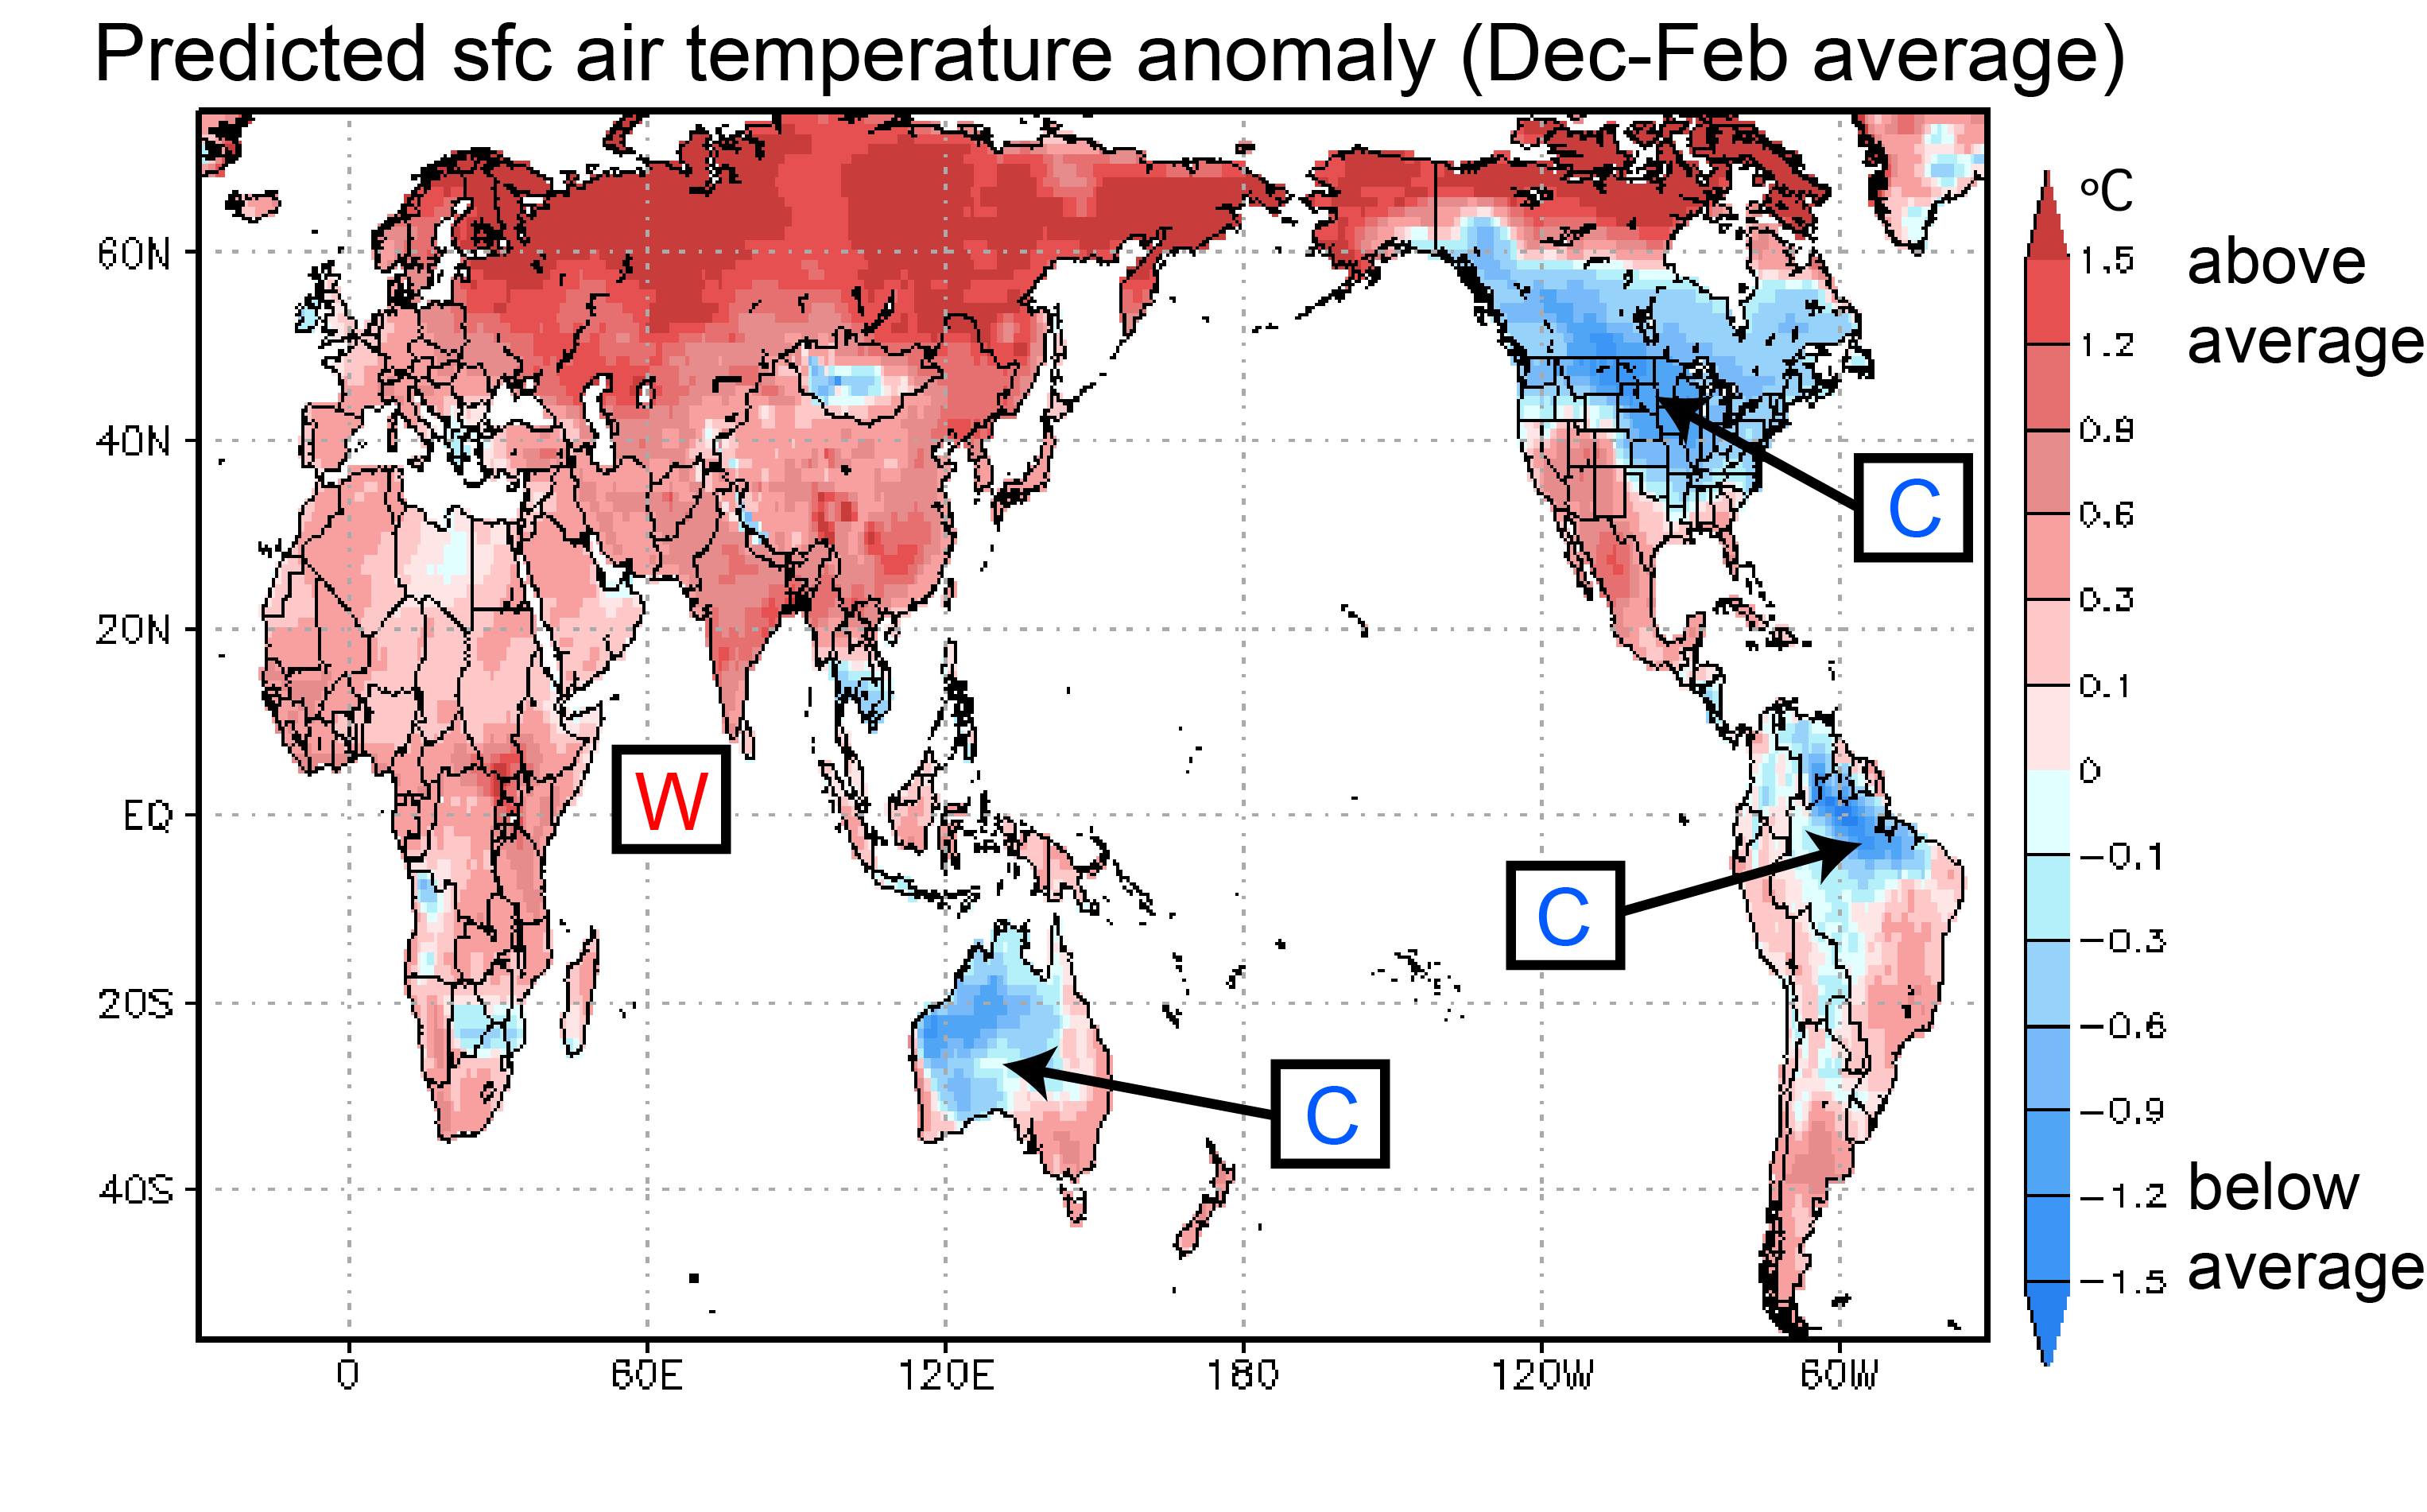
The surface air temperatures for the period December through February are expected to be warmer than average in many areas of the world (Fig. 1). As in the previous forecast, exceptions are northern Brazil and Australia, where temperatures are expected to be cooler than average. Additionally, the model now also calls for colder than average temperatures in the northern US and Canada.
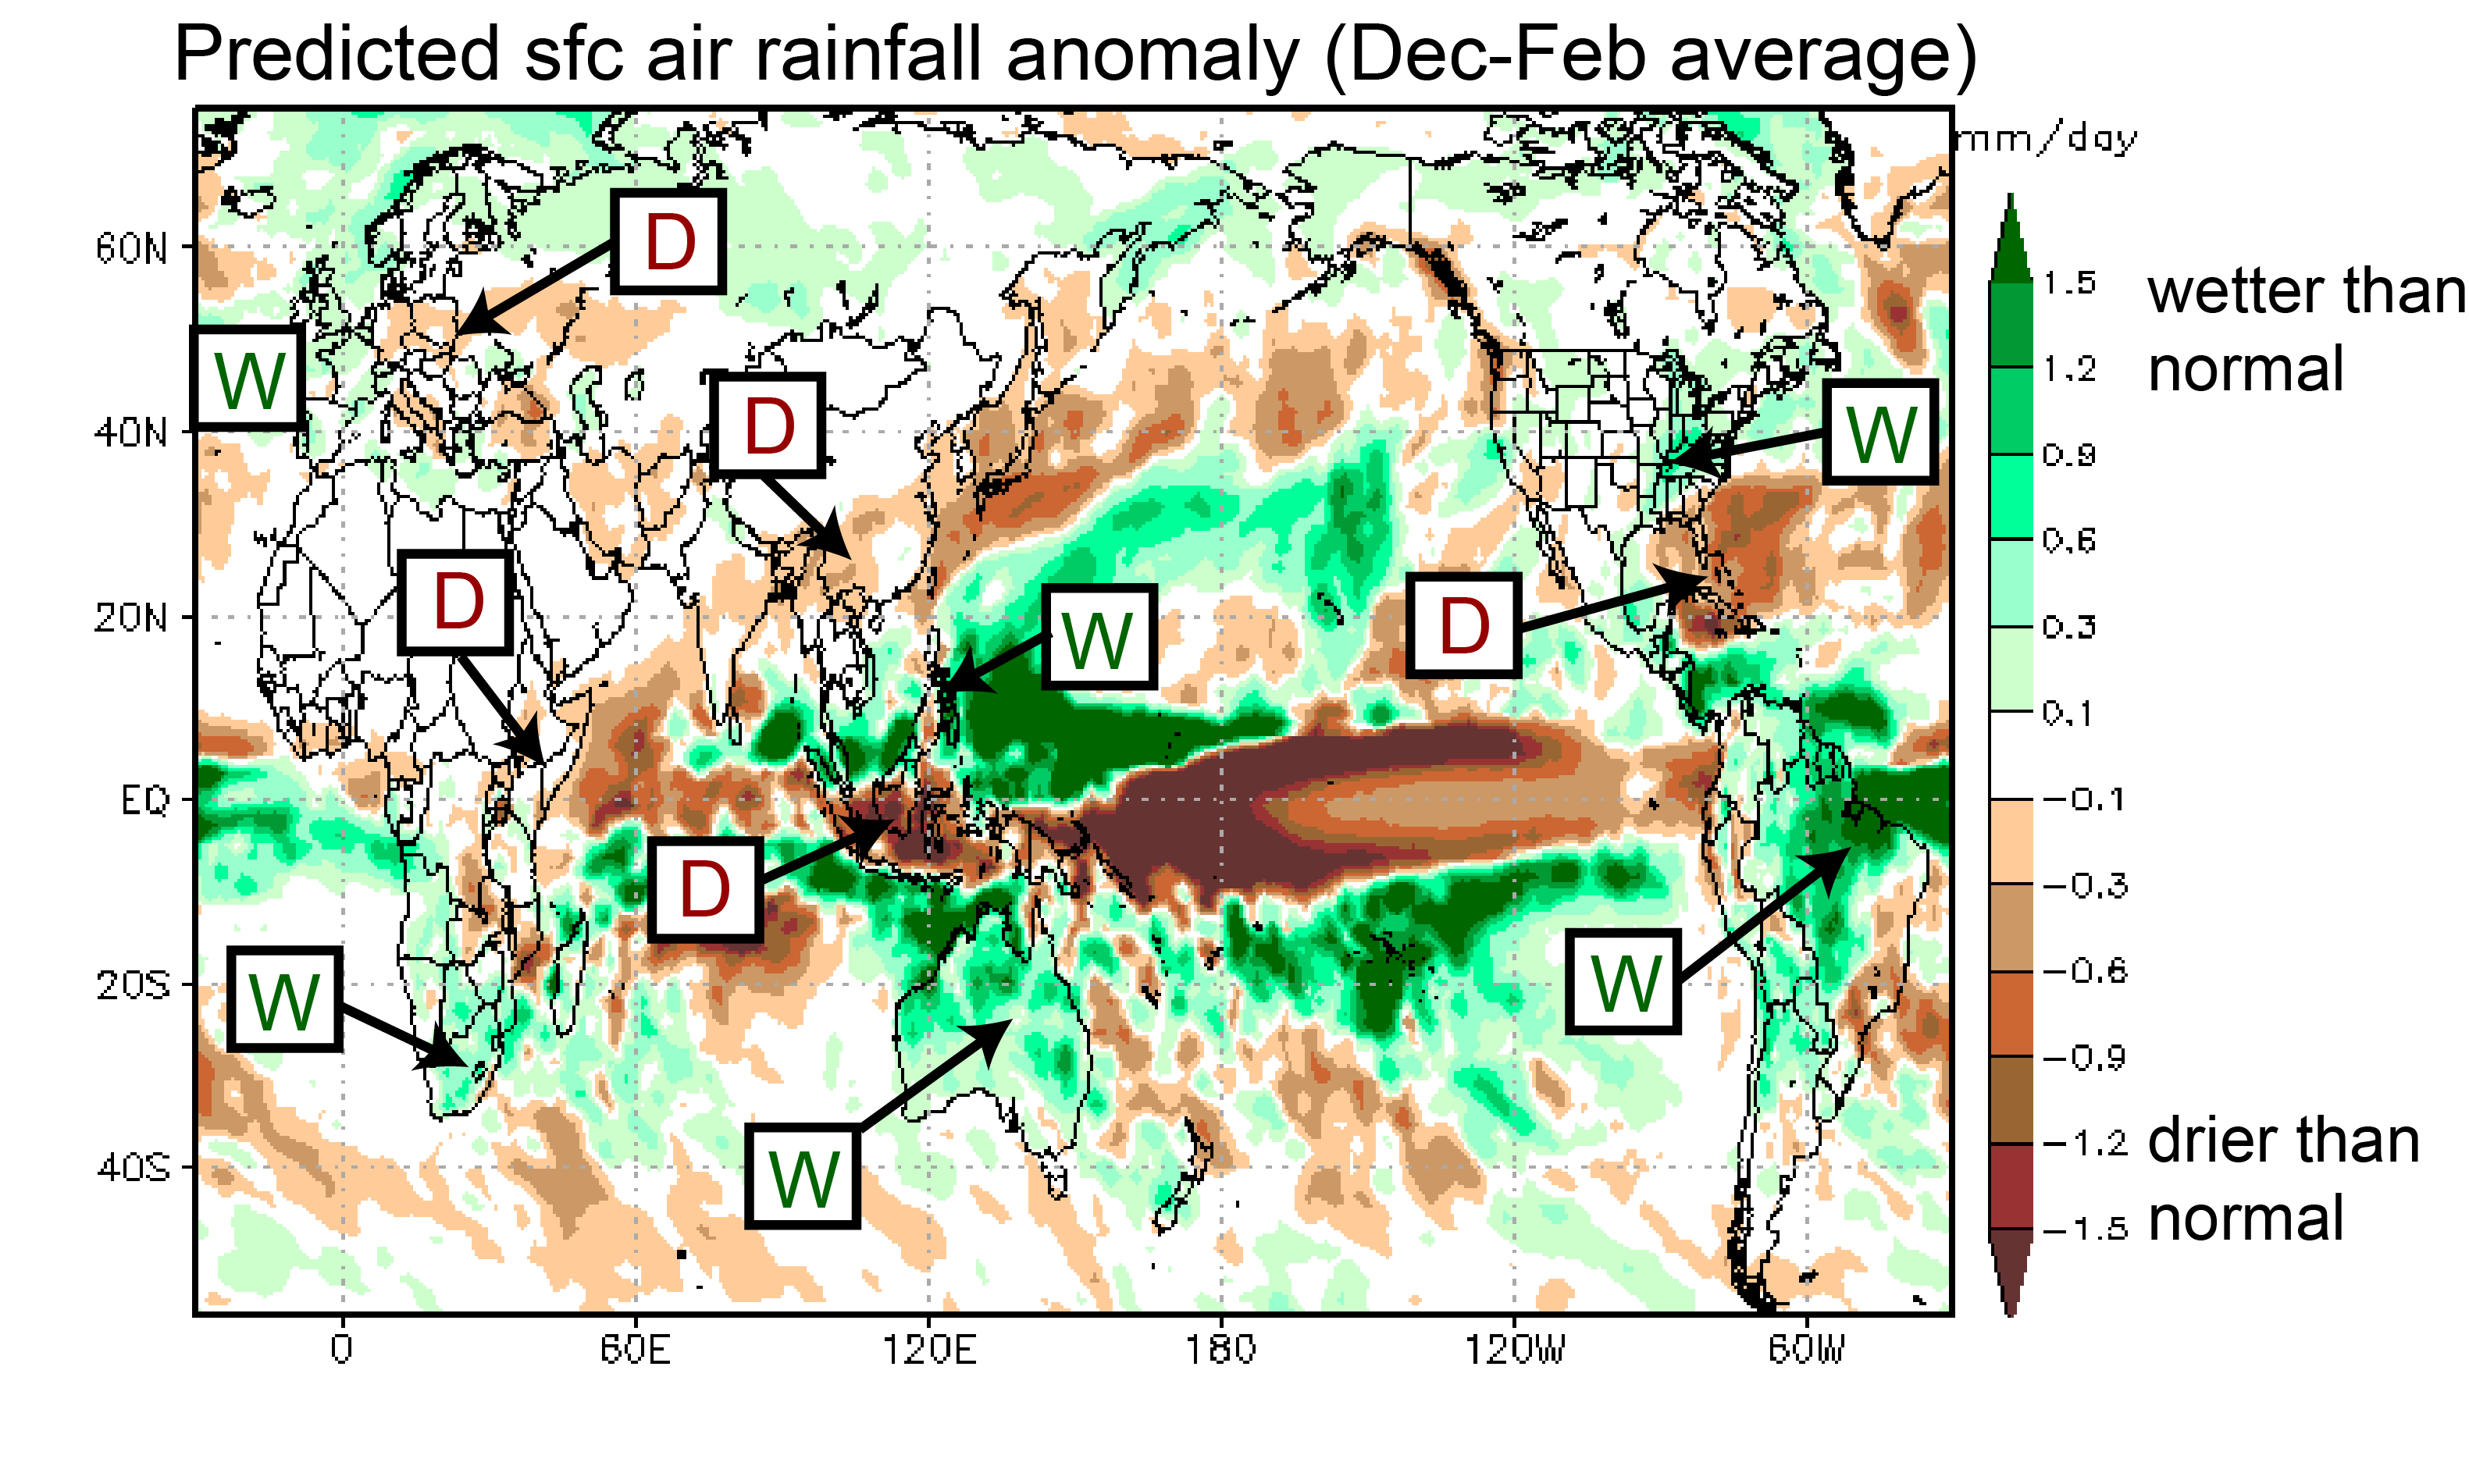
Rainfall is forecast to be below average in southeastern Africa and in many regions of the northern hemisphere, including eastern Europe, southern China, Indonesia, and the Caribbean. Above average rainfall is forecast for the eastern US, Brazil, Australia, the Philippines, western Europe, and southwestern Africa and South Africa.
For Japan, the model indicates warmer than average temperatures and reduced precipitation. Please bear in mind though that the model’s forecast skill in the mid and high latitudes is limited.
Ocean temperatures for the period December through February
In difference to daily weather fluctuations, seasonal climate variations are strongly influenced by changes in sea-surface temperatures (SSTs). Particularly in the tropics, where the SSTs are warmer than in other regions, even small changes in temperature can produce far reaching effects.
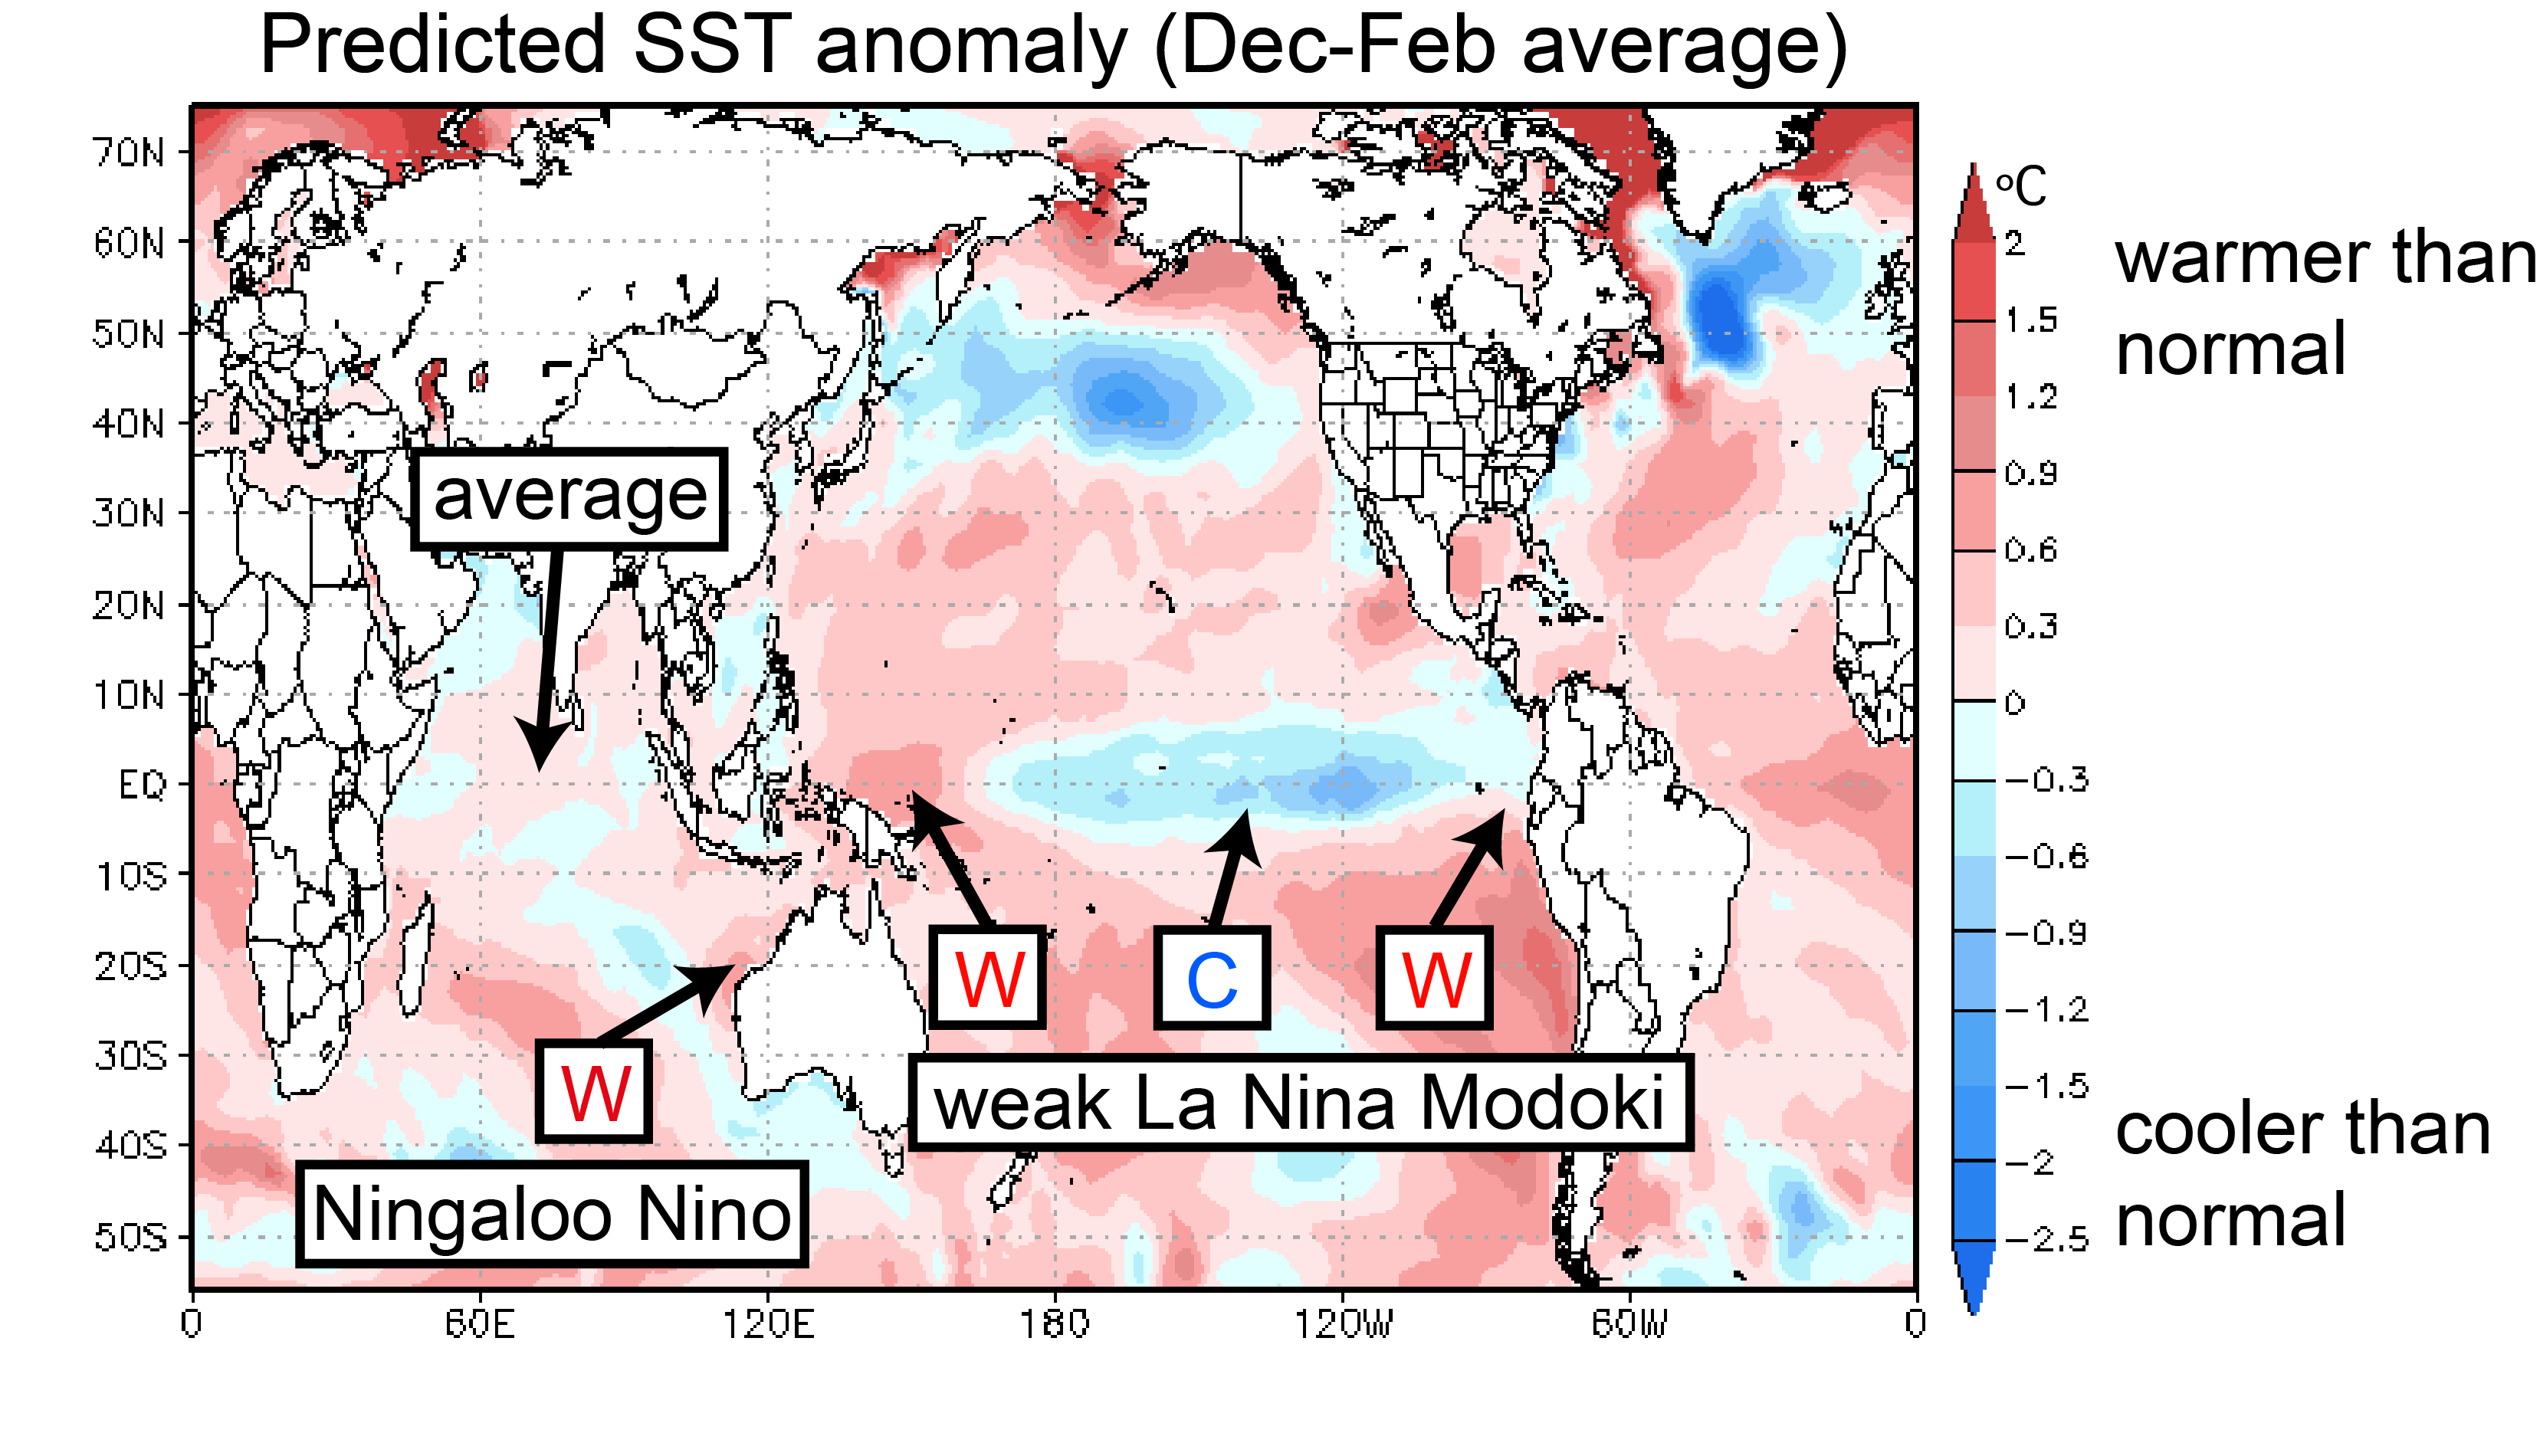
According to the SINTEX-F prediction, weak La Niña Modoki conditions should continue, with cooler than normal SSTs in the central tropical Pacific and warmer than normal SSTs to the west and east (Fig. 3). In the Indian Ocean, the negative phase of the IOD (marked by warmer than average SST in the east and cooler than normal SST in the west) that persisted from summer through fall 2016 will terminate, with conditions returning to average. Off the northwest coast of Australia, ocean temperatures are expected to warm, leading to the development of a Ningaloo Niño event.
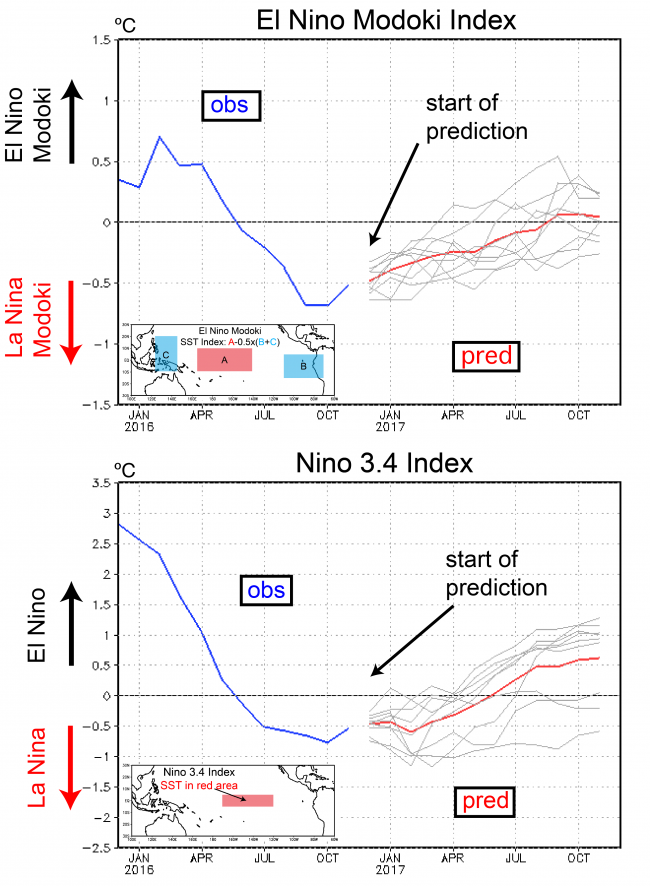
Finally, let’s check the extended outlook for the tropics. Figure 4 shows two indices of interest. The El Niño Modoki index is predicted to decay from its current -0.5 ºC to zero (red line in Fig. 4) and thus should terminate in the summer of 2017. Considering the more traditional Niño 3.4 index, it seems that another El Niño might be in the cards for late 2017. If indeed another El Niño were to develop in 2017 it would likely put an end to the spell of La Niña-like conditions that have dominated over the last 10 years or so. Instead, we might be entering a prolonged period of El Niño-like conditions. This would most certainly mean the end of the so-called “hiatus” in global warming and usher in a period of accelerated warming.
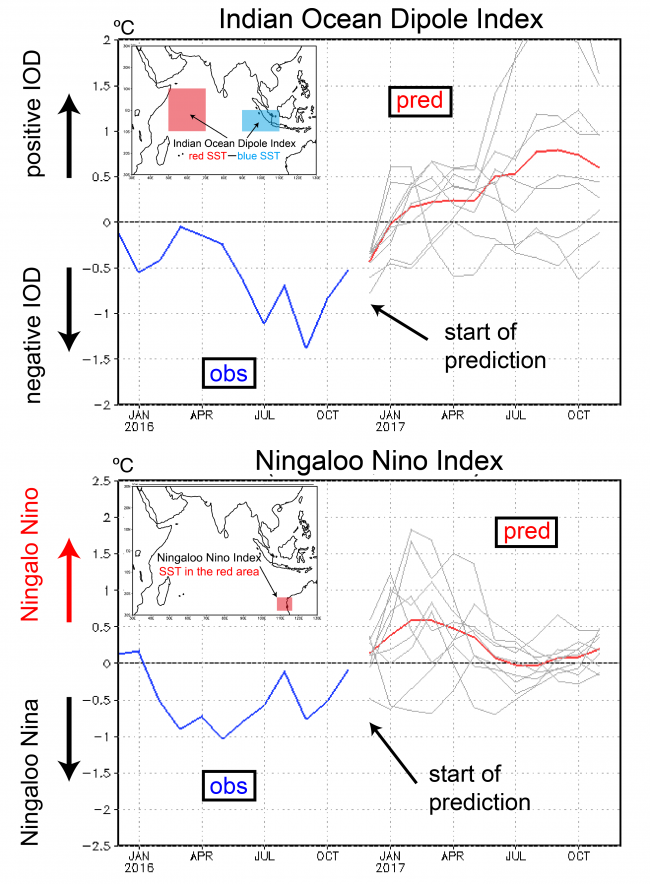
The IOD index, which was about -0.4 ºC at initialization time will decay in January and average conditions will settle in. The model suggests that this will be followed by the development of a positive dipole event in the summer of 2017. The Ningaloo Niño index indicates that sea-surface temperatures in the regions will increase to +0.5 ºC in February, which would signify the occurrence of a Ningaloo Niño event. Both the IOD and Ningaloo predictions, however, should be taken with a grain of salt. As the grey lines in Fig. 5 suggest, the individual ensemble members show a large spread and thus the confidence in these predictions is relatively low at this point.
As it stands right now, there might be some interesting developments ahead in 2017 (climate-wise). Stay tuned for more on this.