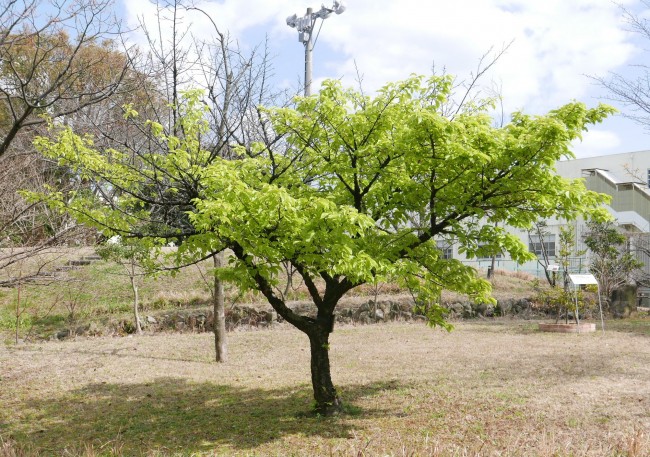

The cherry blossom season is upon us. The early-blooming Kanhi-zakura (bellflower cherry) has already shed its blossoms and is now growing fresh green leaves.
According to the JMA, February was milder than average and featured more rain and snow than usual (link to the Japanese website). So it seems that the SINTEX-F forecast for last winter panned out! For more details, please check out our forecast verification post.
In this post we will look at the SINTEX-F prediction for spring (March through May). According to the SINTEX-F model, surface air temperature will be above normal in most parts of the world, with a few exceptions being southern Canada, the US and Brazil. Above average rainfall is predicted for western South America and the eastern US, while many other parts of the world will see drier than average conditions. This includes eastern Brazil, southeastern China, Indonesia, southern Australia, and Europe. In the tropical Pacific, El Niño is predicted to develop, while in the tropical Indian Ocean conditions will continue to be around average.
Model predictions for summer (June through August) call for further growth of the El Niño but also for the development of a positive Indian Ocean Dipole. The simultaneous occurrence of a strong El Niño and a strong positive Indian Ocean Dipole is a rare event (the only precedents to this in the observational record are 1997 and 2015) and may lead to unusual weather patterns the world round. More on this in the following.
Air temperature and rain forecast for the period March through May
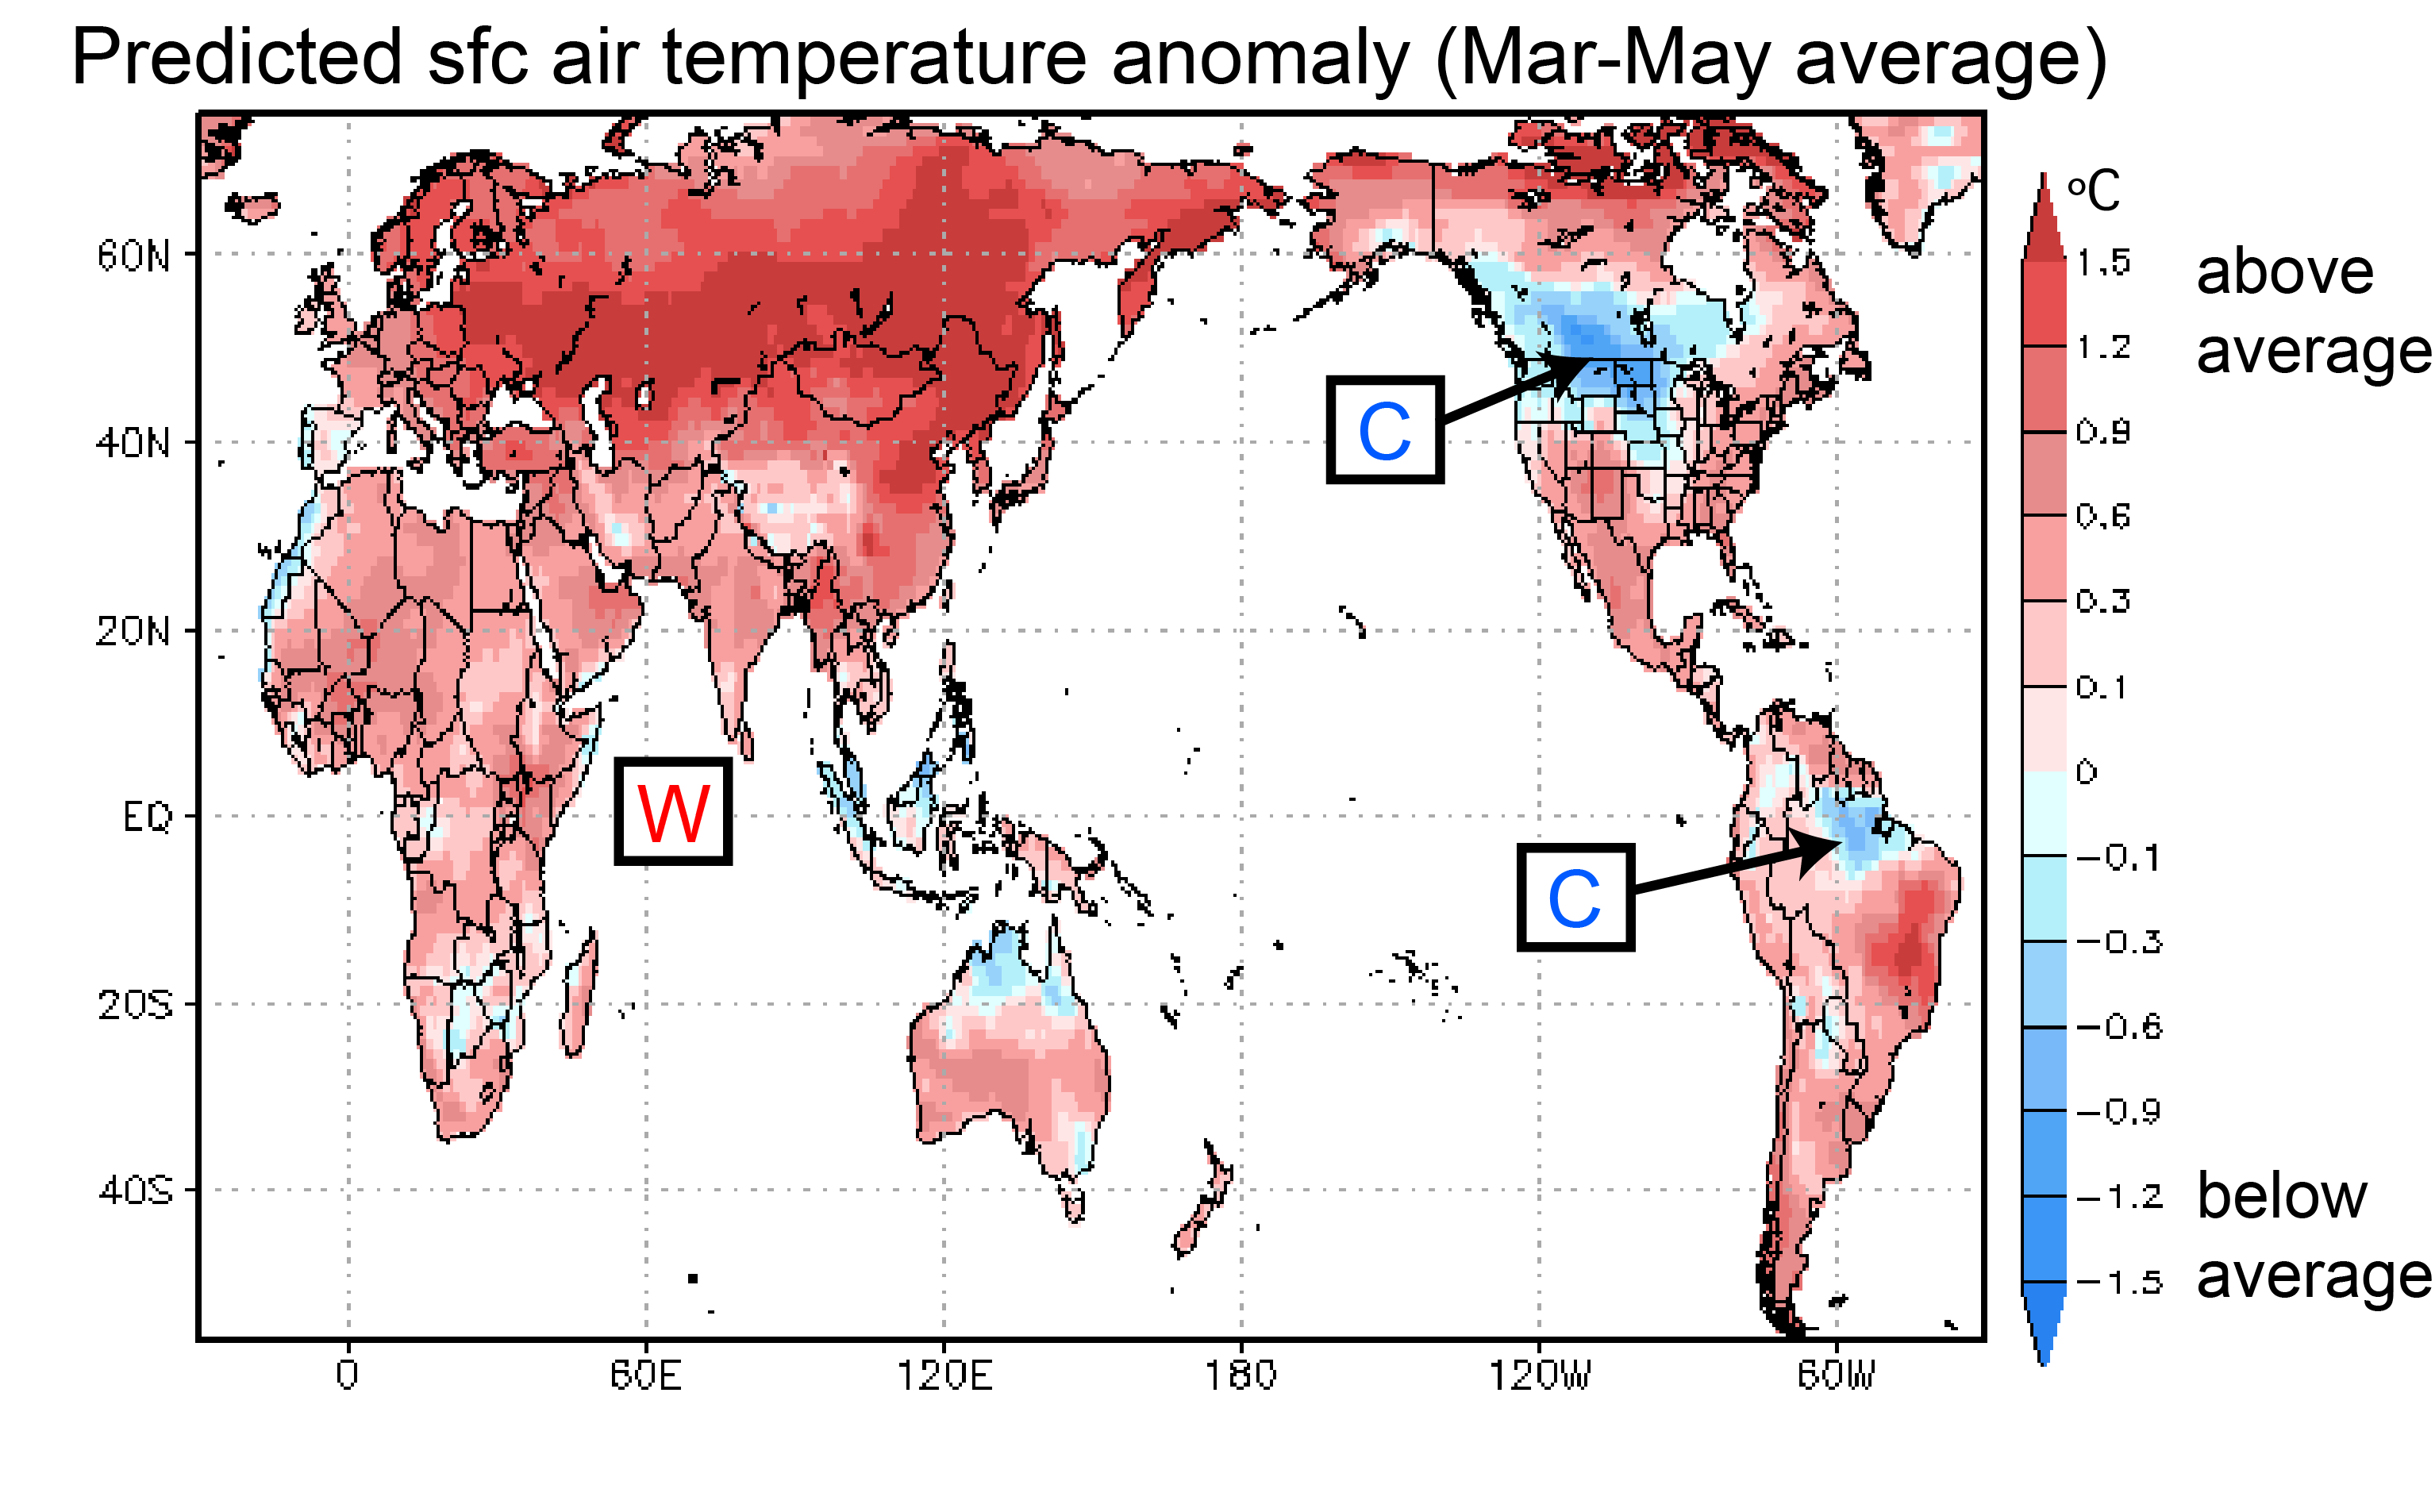
As stated above, surface air temperature will be above normal in most parts of the world with the exception of southern Canada, the northern US, northern Brazil, and few more locations in the world (Fig. 1).
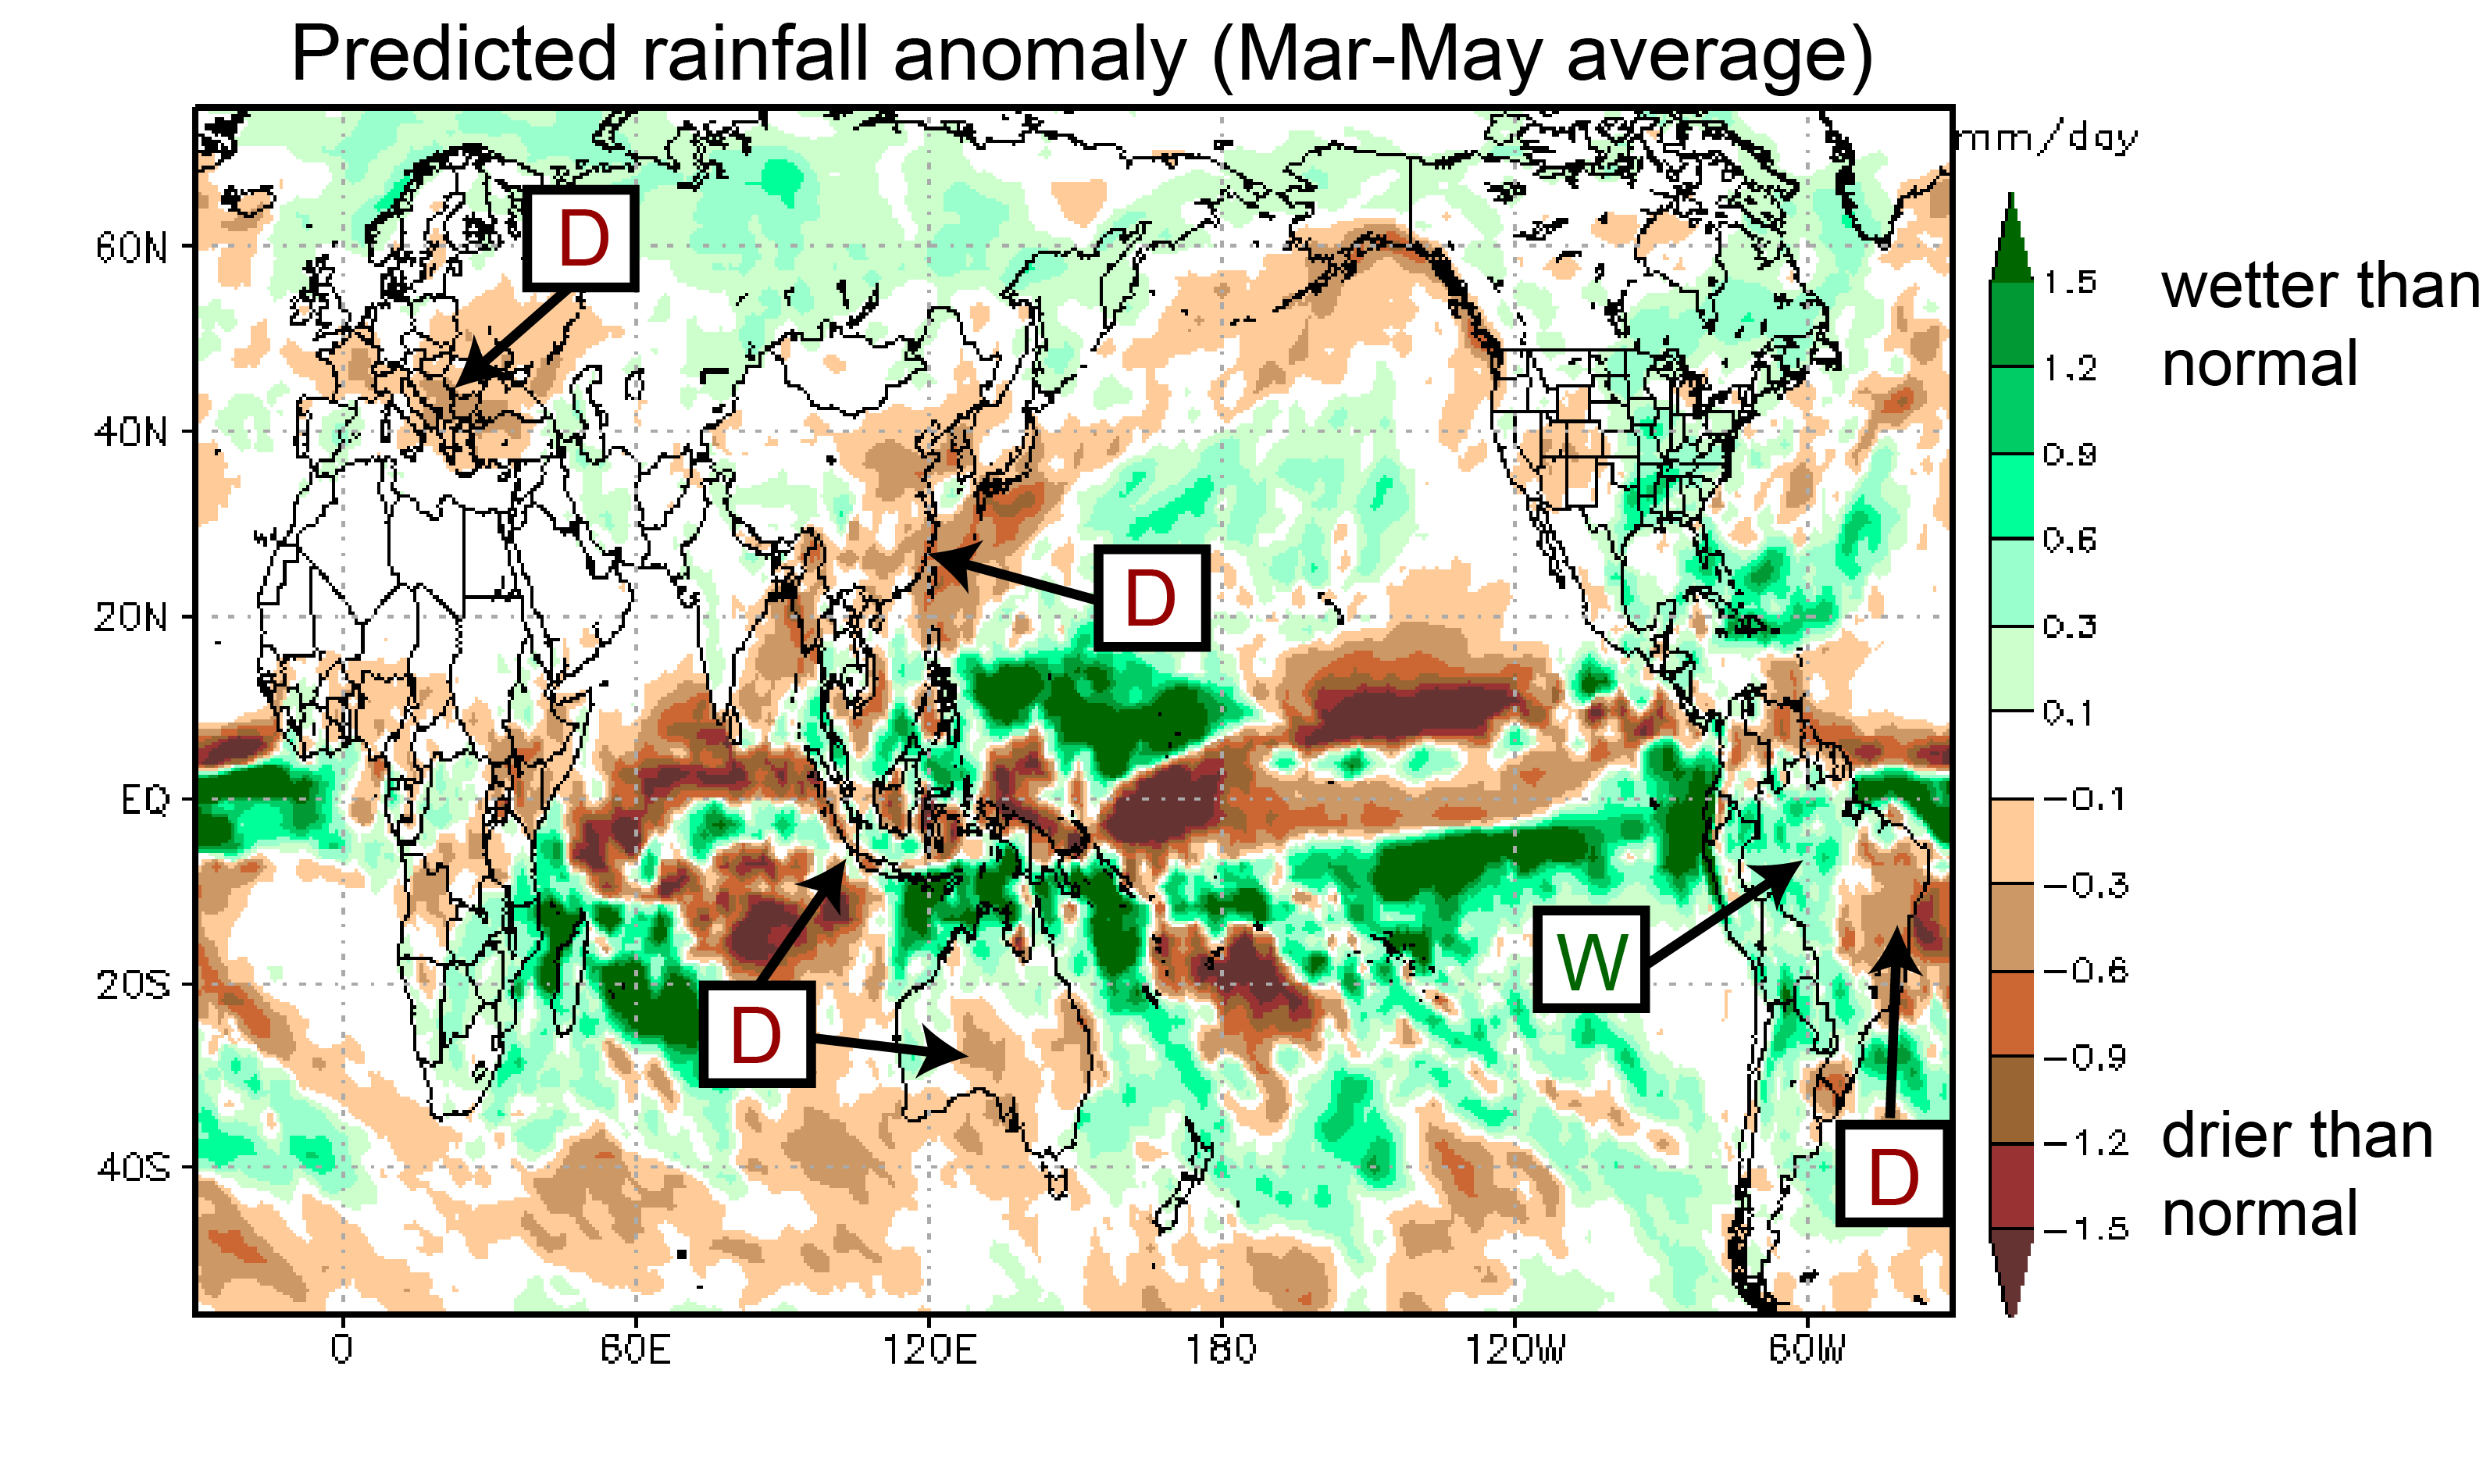
Rainfall is forecast to be above average in western South America (including western Brazil) and the eastern US (Fig. 2). Many other areas are expected to experience drier than average conditions. This includes eastern Brazil, southeastern China, Indonesia, southern Australia, and Europe.
For Japan, the model calls for a warm and dry spring. Please bear in mind though that the model’s forecast skill in the mid and high latitudes is rather limited.
Ocean temperatures for the period March through May
In difference to daily weather fluctuations, seasonal climate variations are strongly influenced by changes in sea-surface temperatures (SSTs). Particularly in the tropics, where the SSTs are warmer than in other regions, even small changes in temperature can produce far reaching effects.
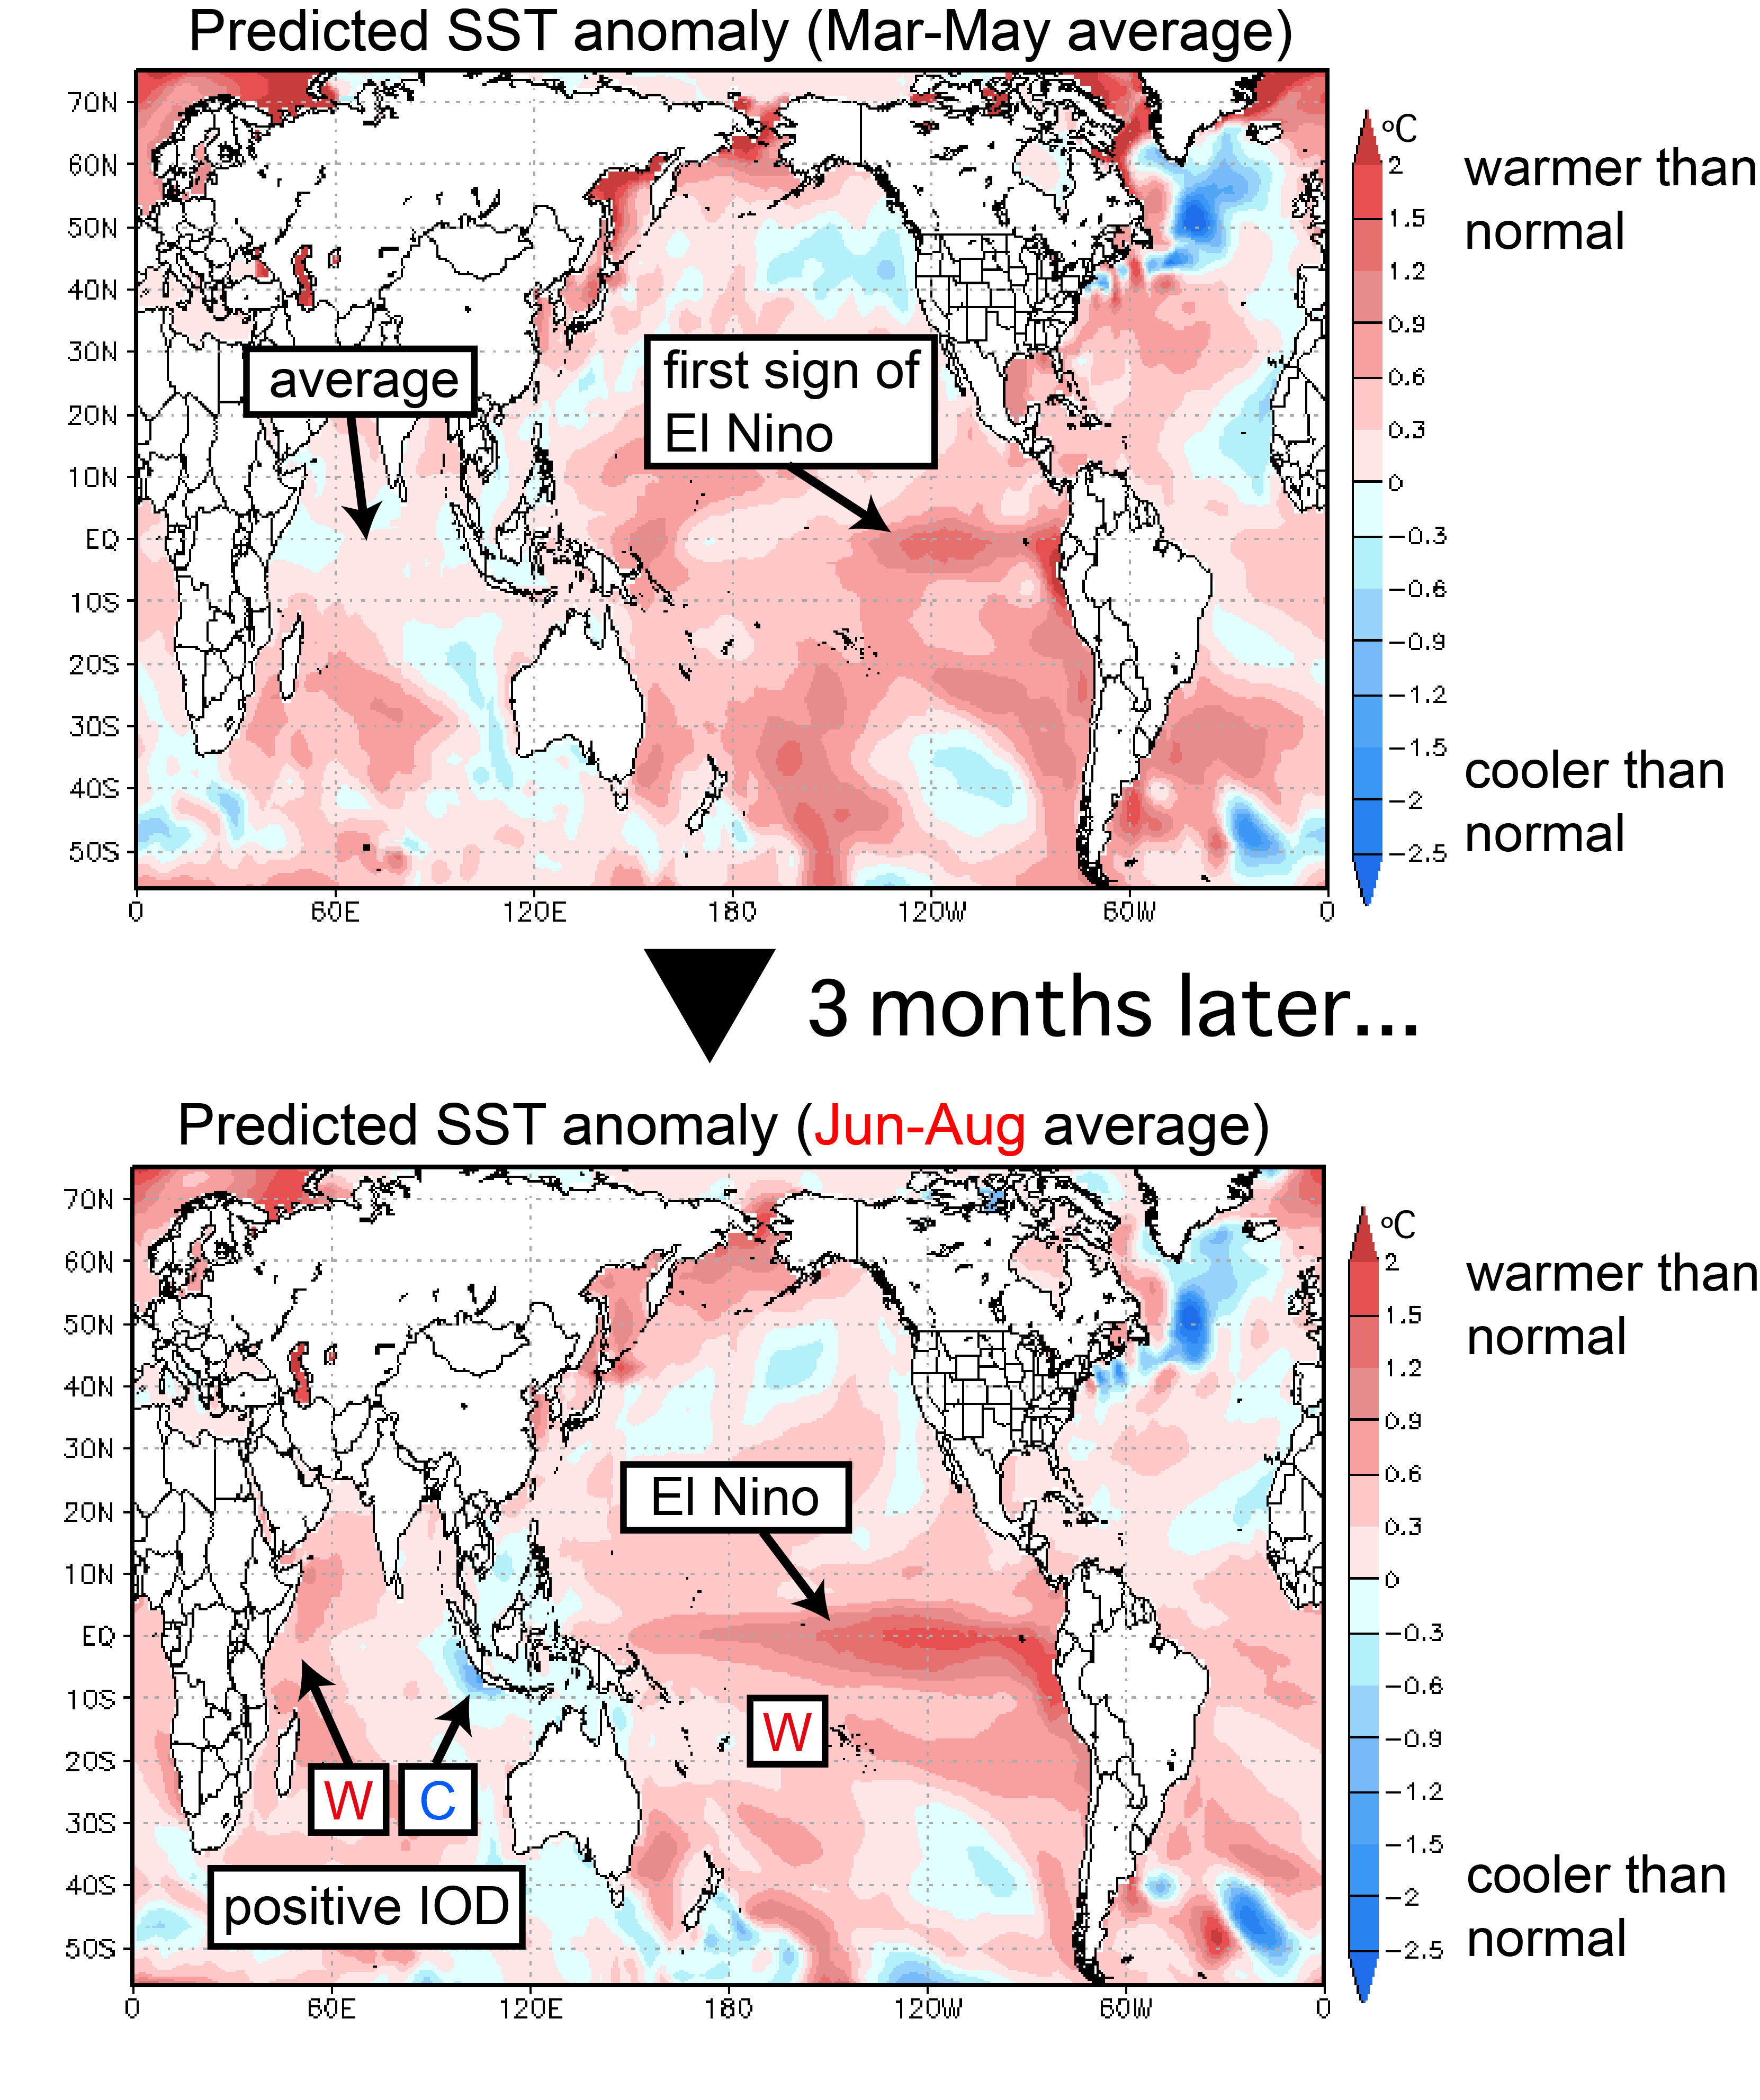
According to the SINTEX-F prediction for spring, SST will be above average in the eastern tropical Pacific (Fig. 3, upper panel), indicating a nascent El Niño event. In the tropical Indian Ocean, conditions will continue to be around average.
If we look further ahead to the following season (June through August; lower panel in Figure 3) we see that El Niño is predicted to strengthen, while in the Indian Ocean a positive dipole event will start to develop.
In Japan, the simultaneous occurrence of these two phenomena is expected to lead to cooler than average temperatures in northern Japan, and warmer than average temperatures in western Japan. This pattern is also known as “cool north hot west”. El Niño tends to weaken the Ogasawara High (a high pressure system southeast of Honshu Island), and this tends to produce instability, rain, and cooler temperatures over northern Japan. Western Japan, on the other hand, is dominated by the positive Indian Ocean Dipole, which overrides El Niño’s influence and leads to hot temperatures. A simultaneous strong El Niño and strong positive Indian Ocean Dipole have only been observed twice: in 1997 and in 2015.
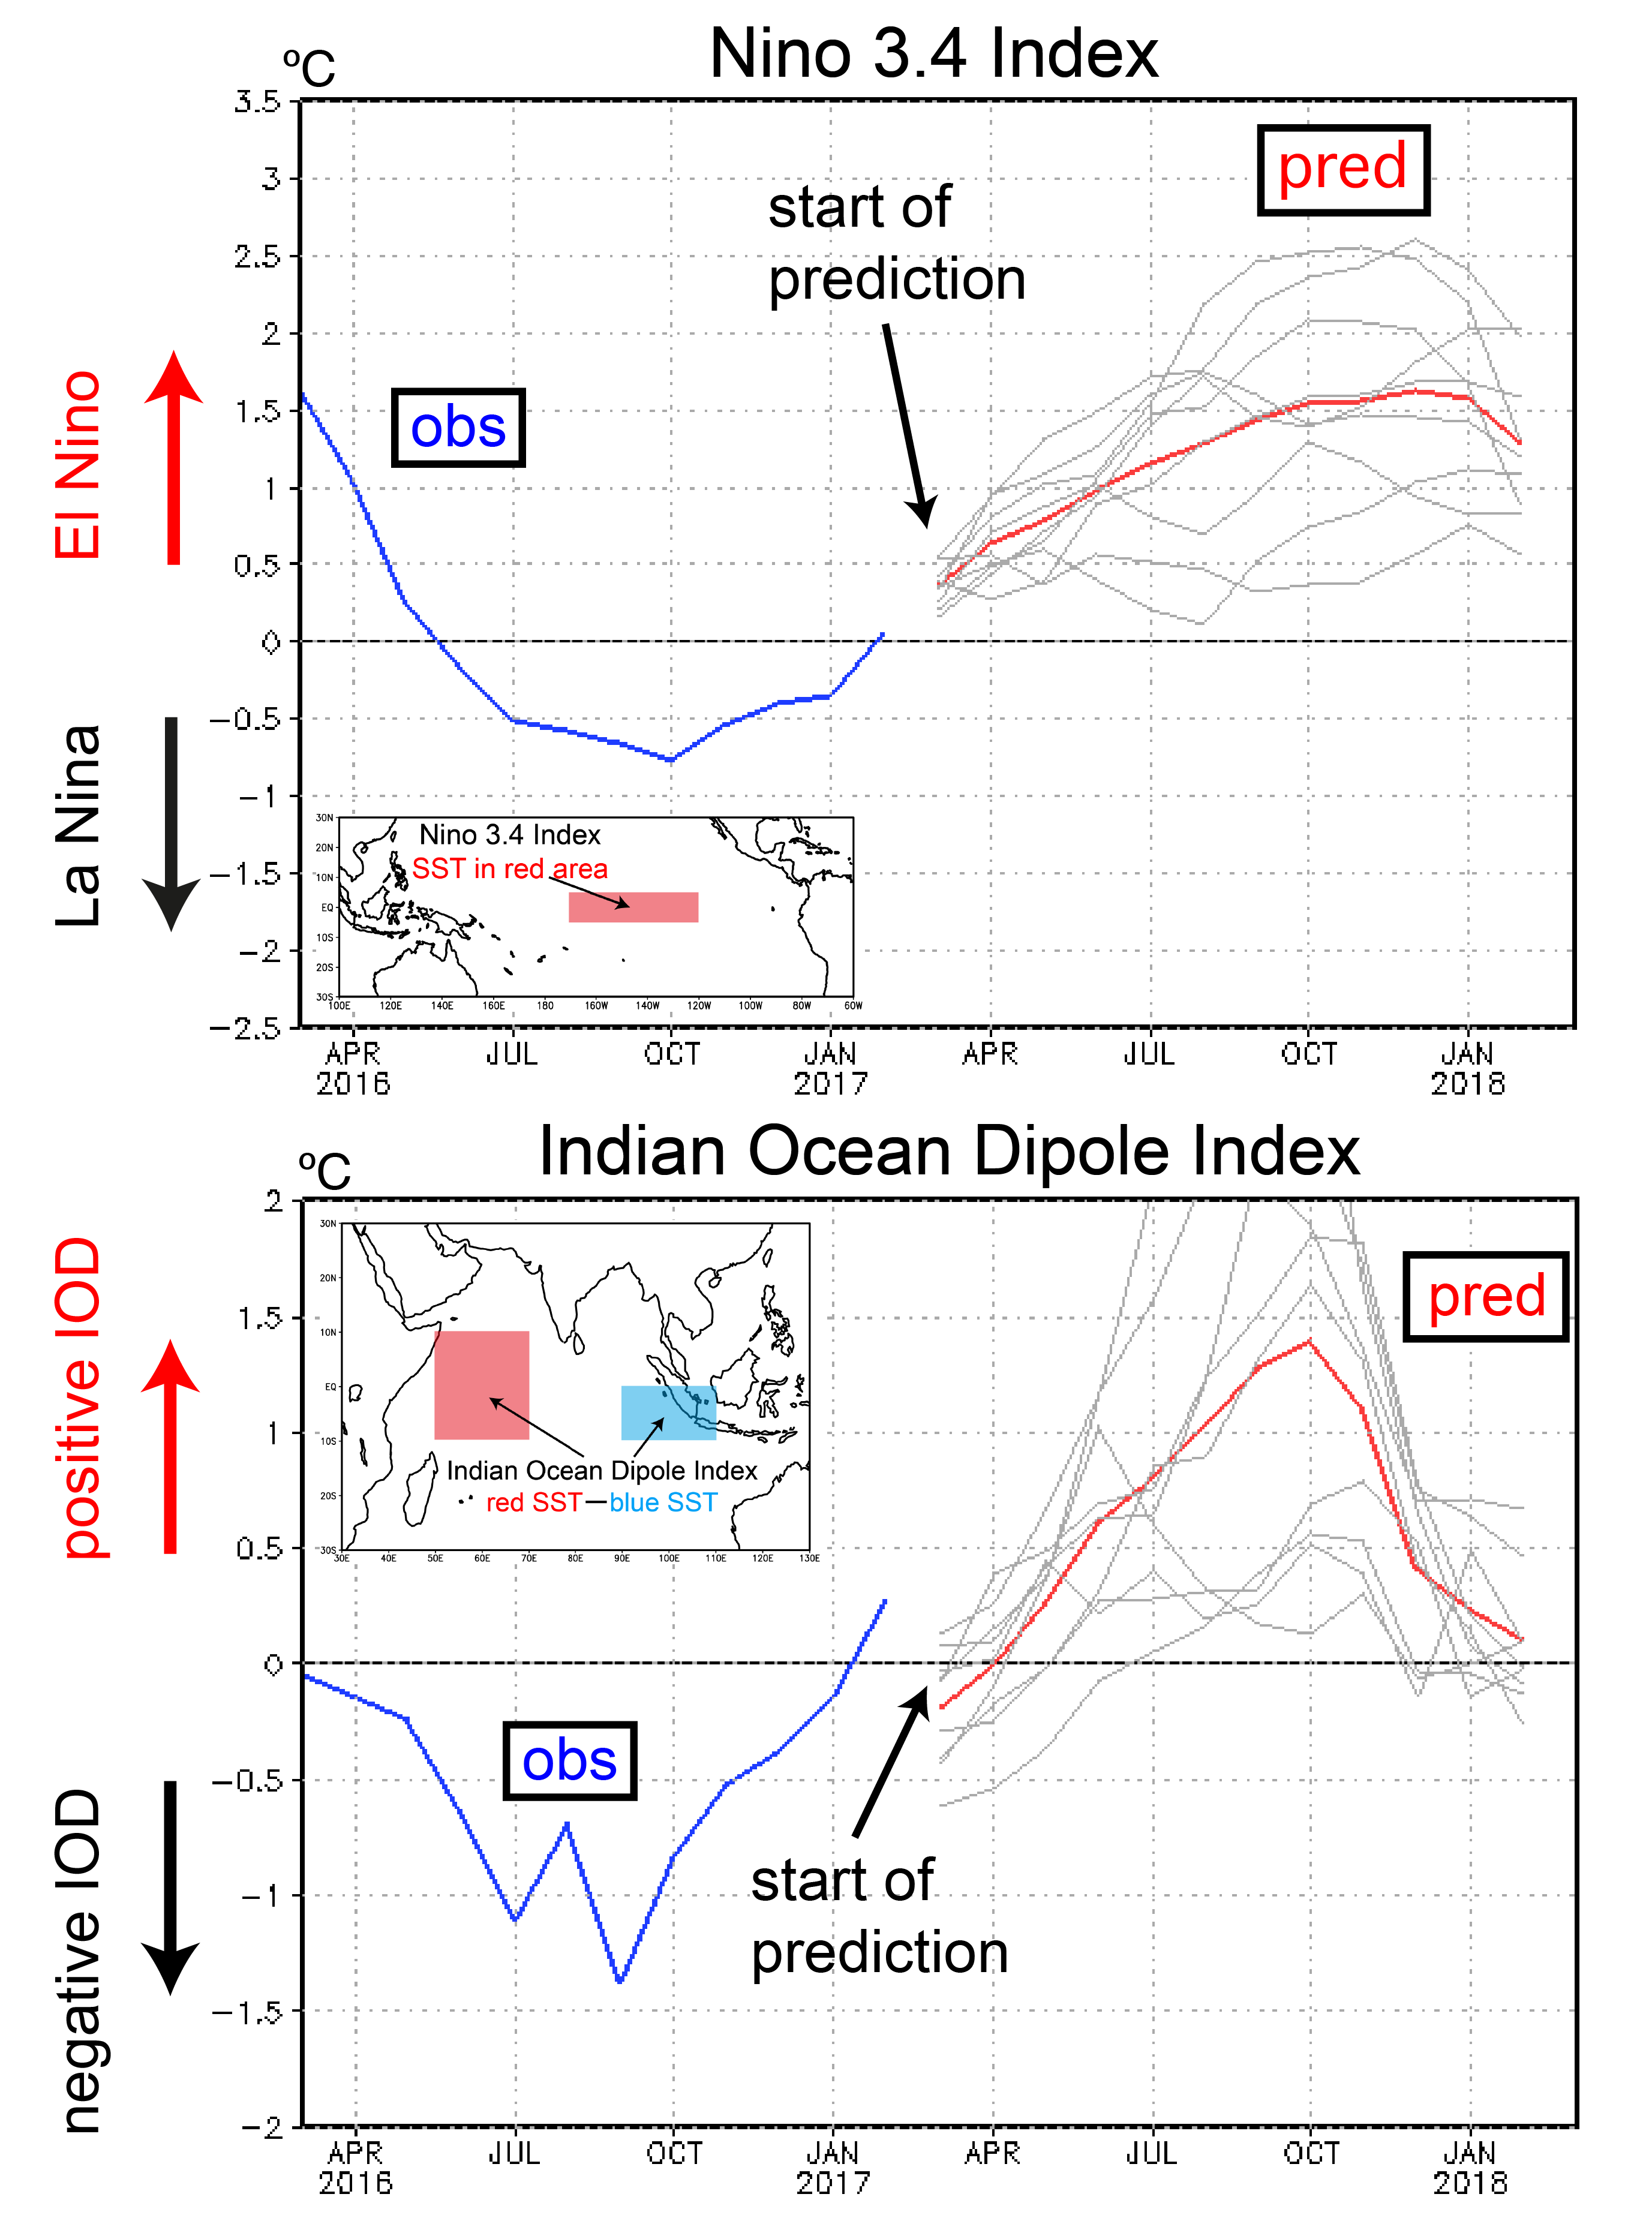
For the longer-term outlook let’s take a look at Figure 4, which shows two indices of interest. The Niño 3.4 index is predicted to exceed +0.5 °C in April and +1 °C in July (red line in the upper panel of Fig. 4). As we mentioned before, if indeed another El Niño were to develop in 2017 it would likely put an end to the spell of La Niña-like conditions that have prevailed over the last 10 years or so. Instead, we might be entering a prolonged period of El Niño-like conditions. This would most certainly mean the end of the so-called “hiatus” in global warming and usher in a period of accelerated warming.
The IOD index will stay around neutral for a while but is predicted to exceed +0.5 °C in June and reach its peak in fall. Note, however, that the ensemble spread (grey lines in Fig. 4, lower panel) is very large, so it is still quite uncertain exactly how strong this event will be.
Both the El Niño/La Niña and the Indian Ocean Dipole have significant climatic impacts the world round. The rare co-occurrence of an El Niño and a positive Indian Ocean Dipole should lead to unusual variability patterns worldwide and we will certainly be keeping an eye on that.