Quick summary:
- drought in Indonesia and Australia likely to continue
- weak La Niña conditions this fall and winter
- positive IOD to peak in October
- outlook for Japan: slightly warmer and drier than average in fall

During the last few weeks some of us were visiting South Africa to work on a project that assess the link between climate variations and the outbreak of infectious diseases. South Africa is in the southern hemisphere and so spring is starting there. Some regions of the country tend to get most of their rain in winter but this year rain has been sparse and drought conditions are intensifying. Drought is also intensifying on the other side of the Indian Ocean in Indonesia and Australia and the positive Indian Ocean Dipole (IOD) in the tropics likely plays a large role in this. As early as June our model confidently predicted the development of a positive IOD and we pointed out the increased drought risk in those regions. Due to the IOD conditions those droughts are likely to continue.
Western Japan was under the influence of the Ogasawara high (a high-pressure system over the western North Pacific; also known as Bonin high), which brought hot and dry weather during August. Eastern and northern Japan, on the other hand, were influenced by cool Yamase winds, which were caused by high pressure to the north over the Sea of Okhotsk (link to the JMA briefing; in Japanese).
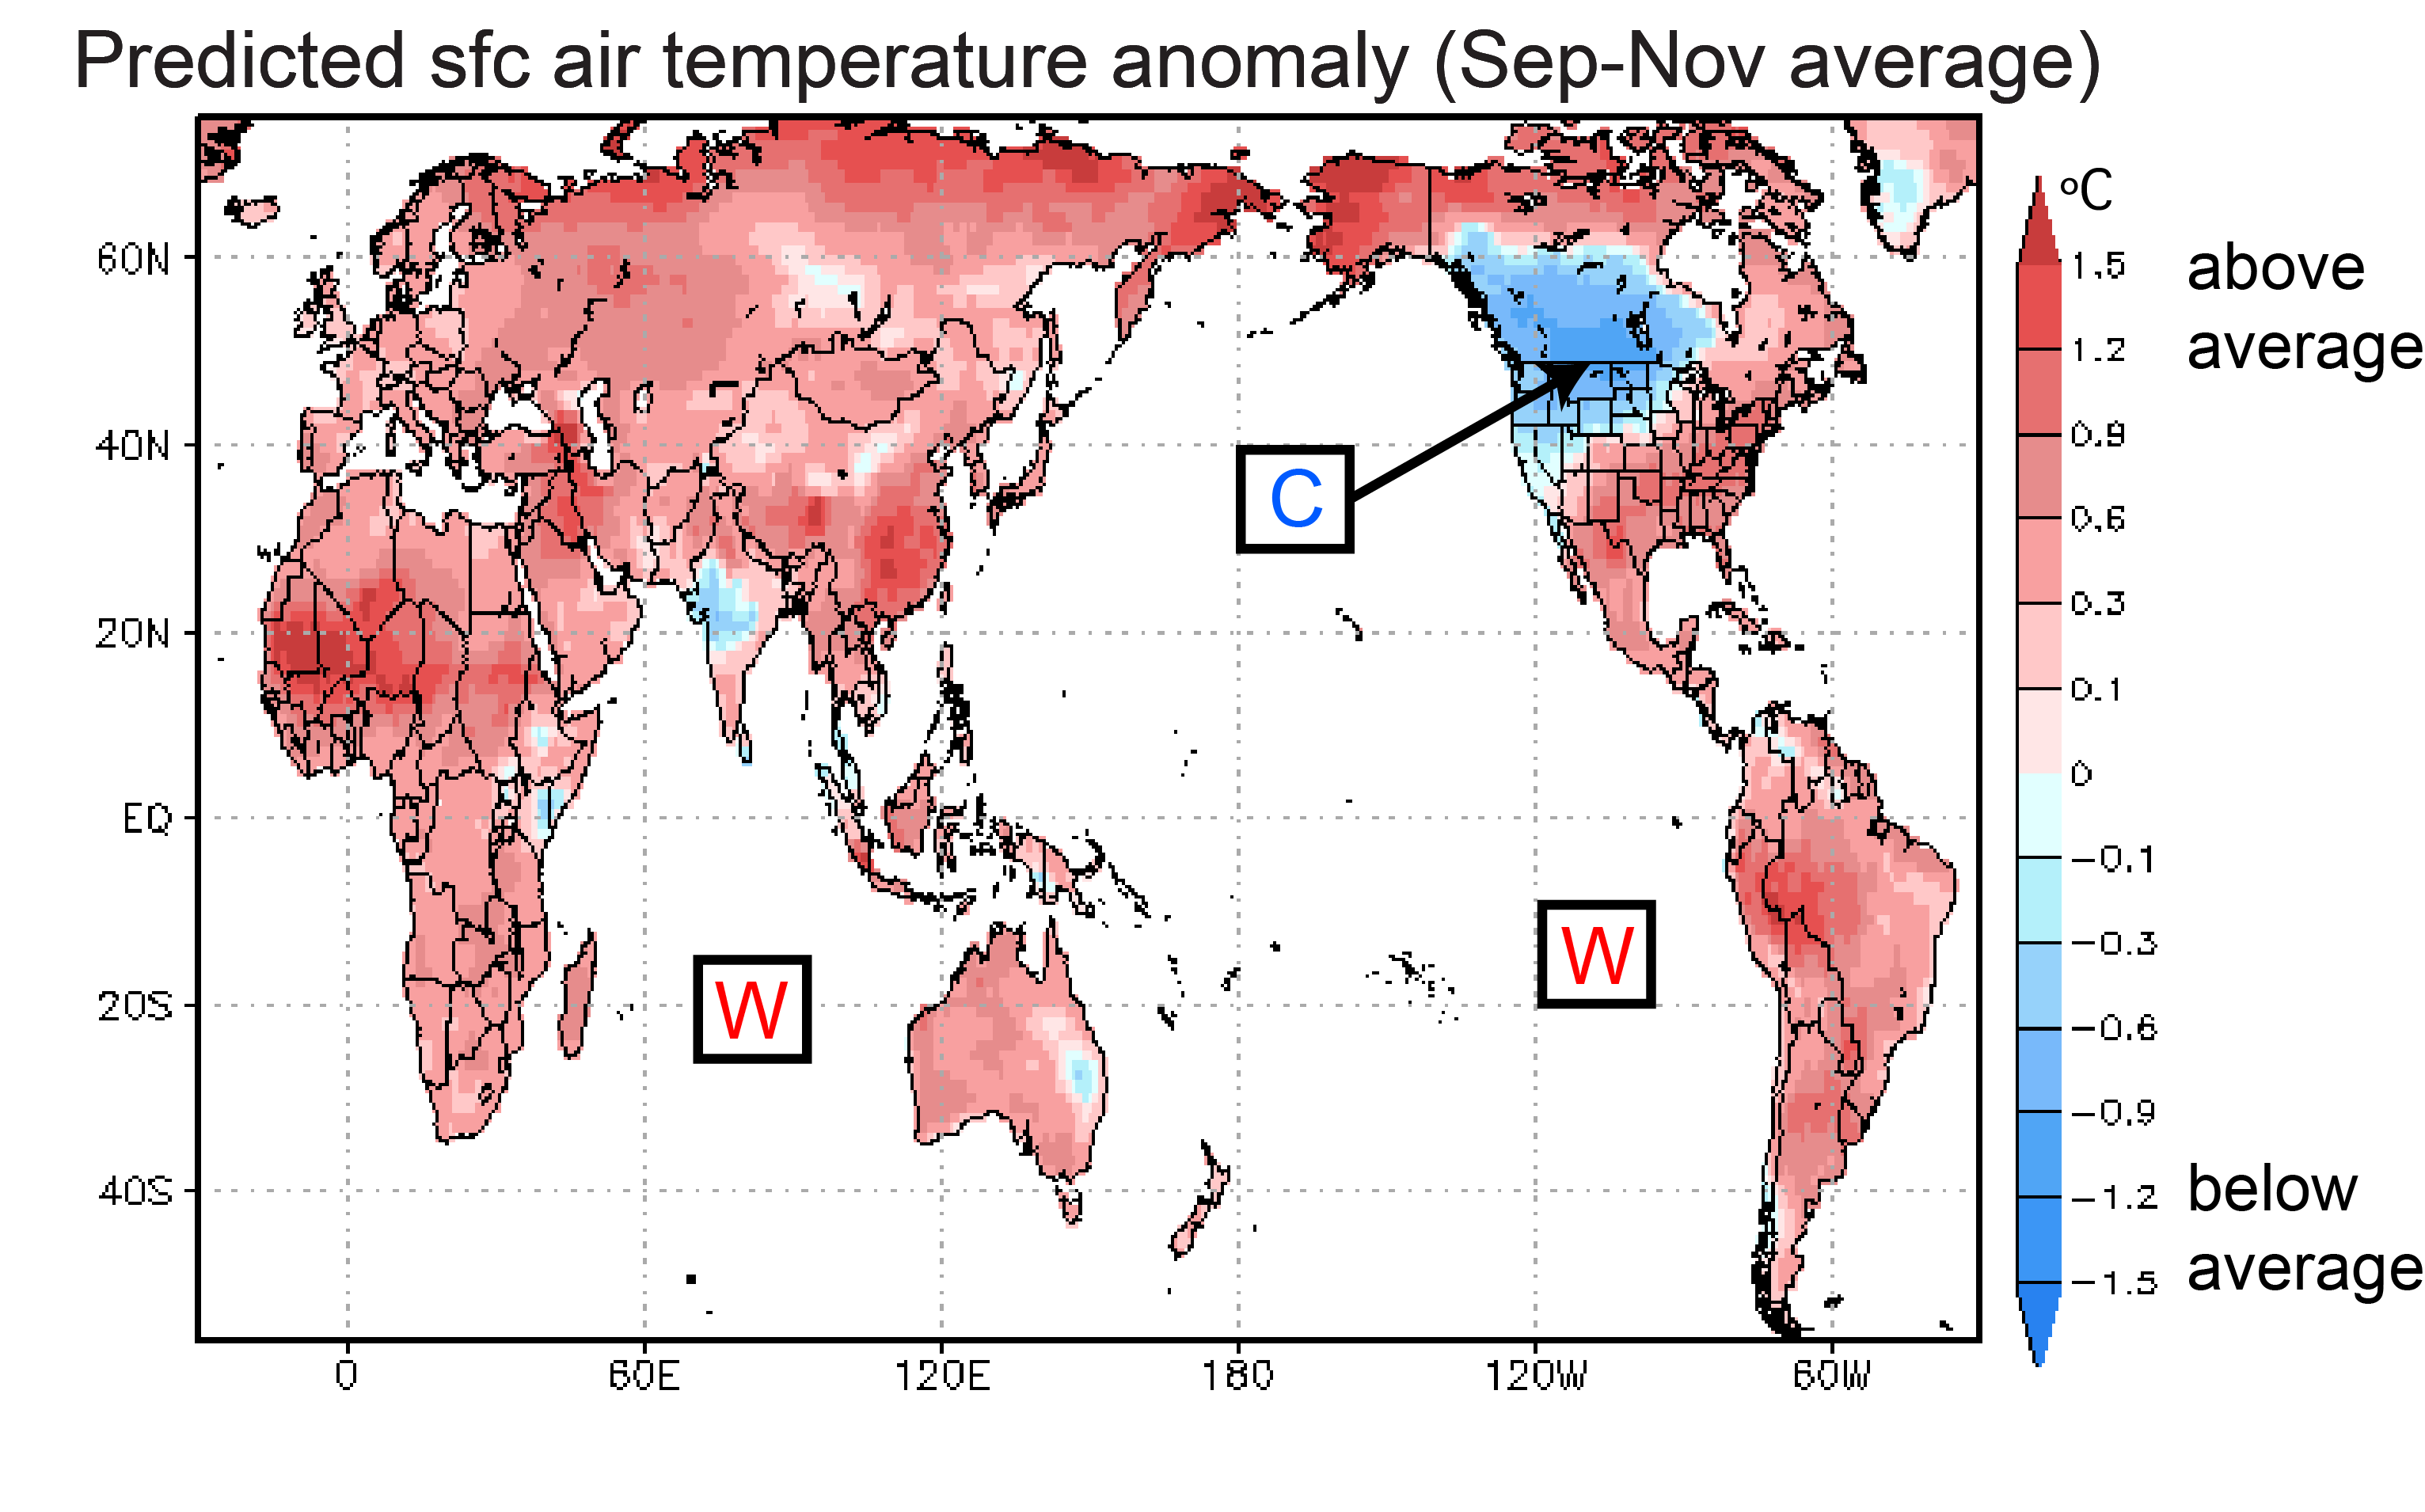
Let’s take a look at the latest predictions for this fall. According to the SINTEX-F model, surface air temperatures over land will be above average over most land areas from September through November (Fig. 1). One notable change from last month’s forecast is the cooler than average temperature predicted for the northwestern US and Canada. This change might be linked to the strengthening La Niña in the Pacific, which is often associated with cooler temperatures in the Pacific Northwest during winter.
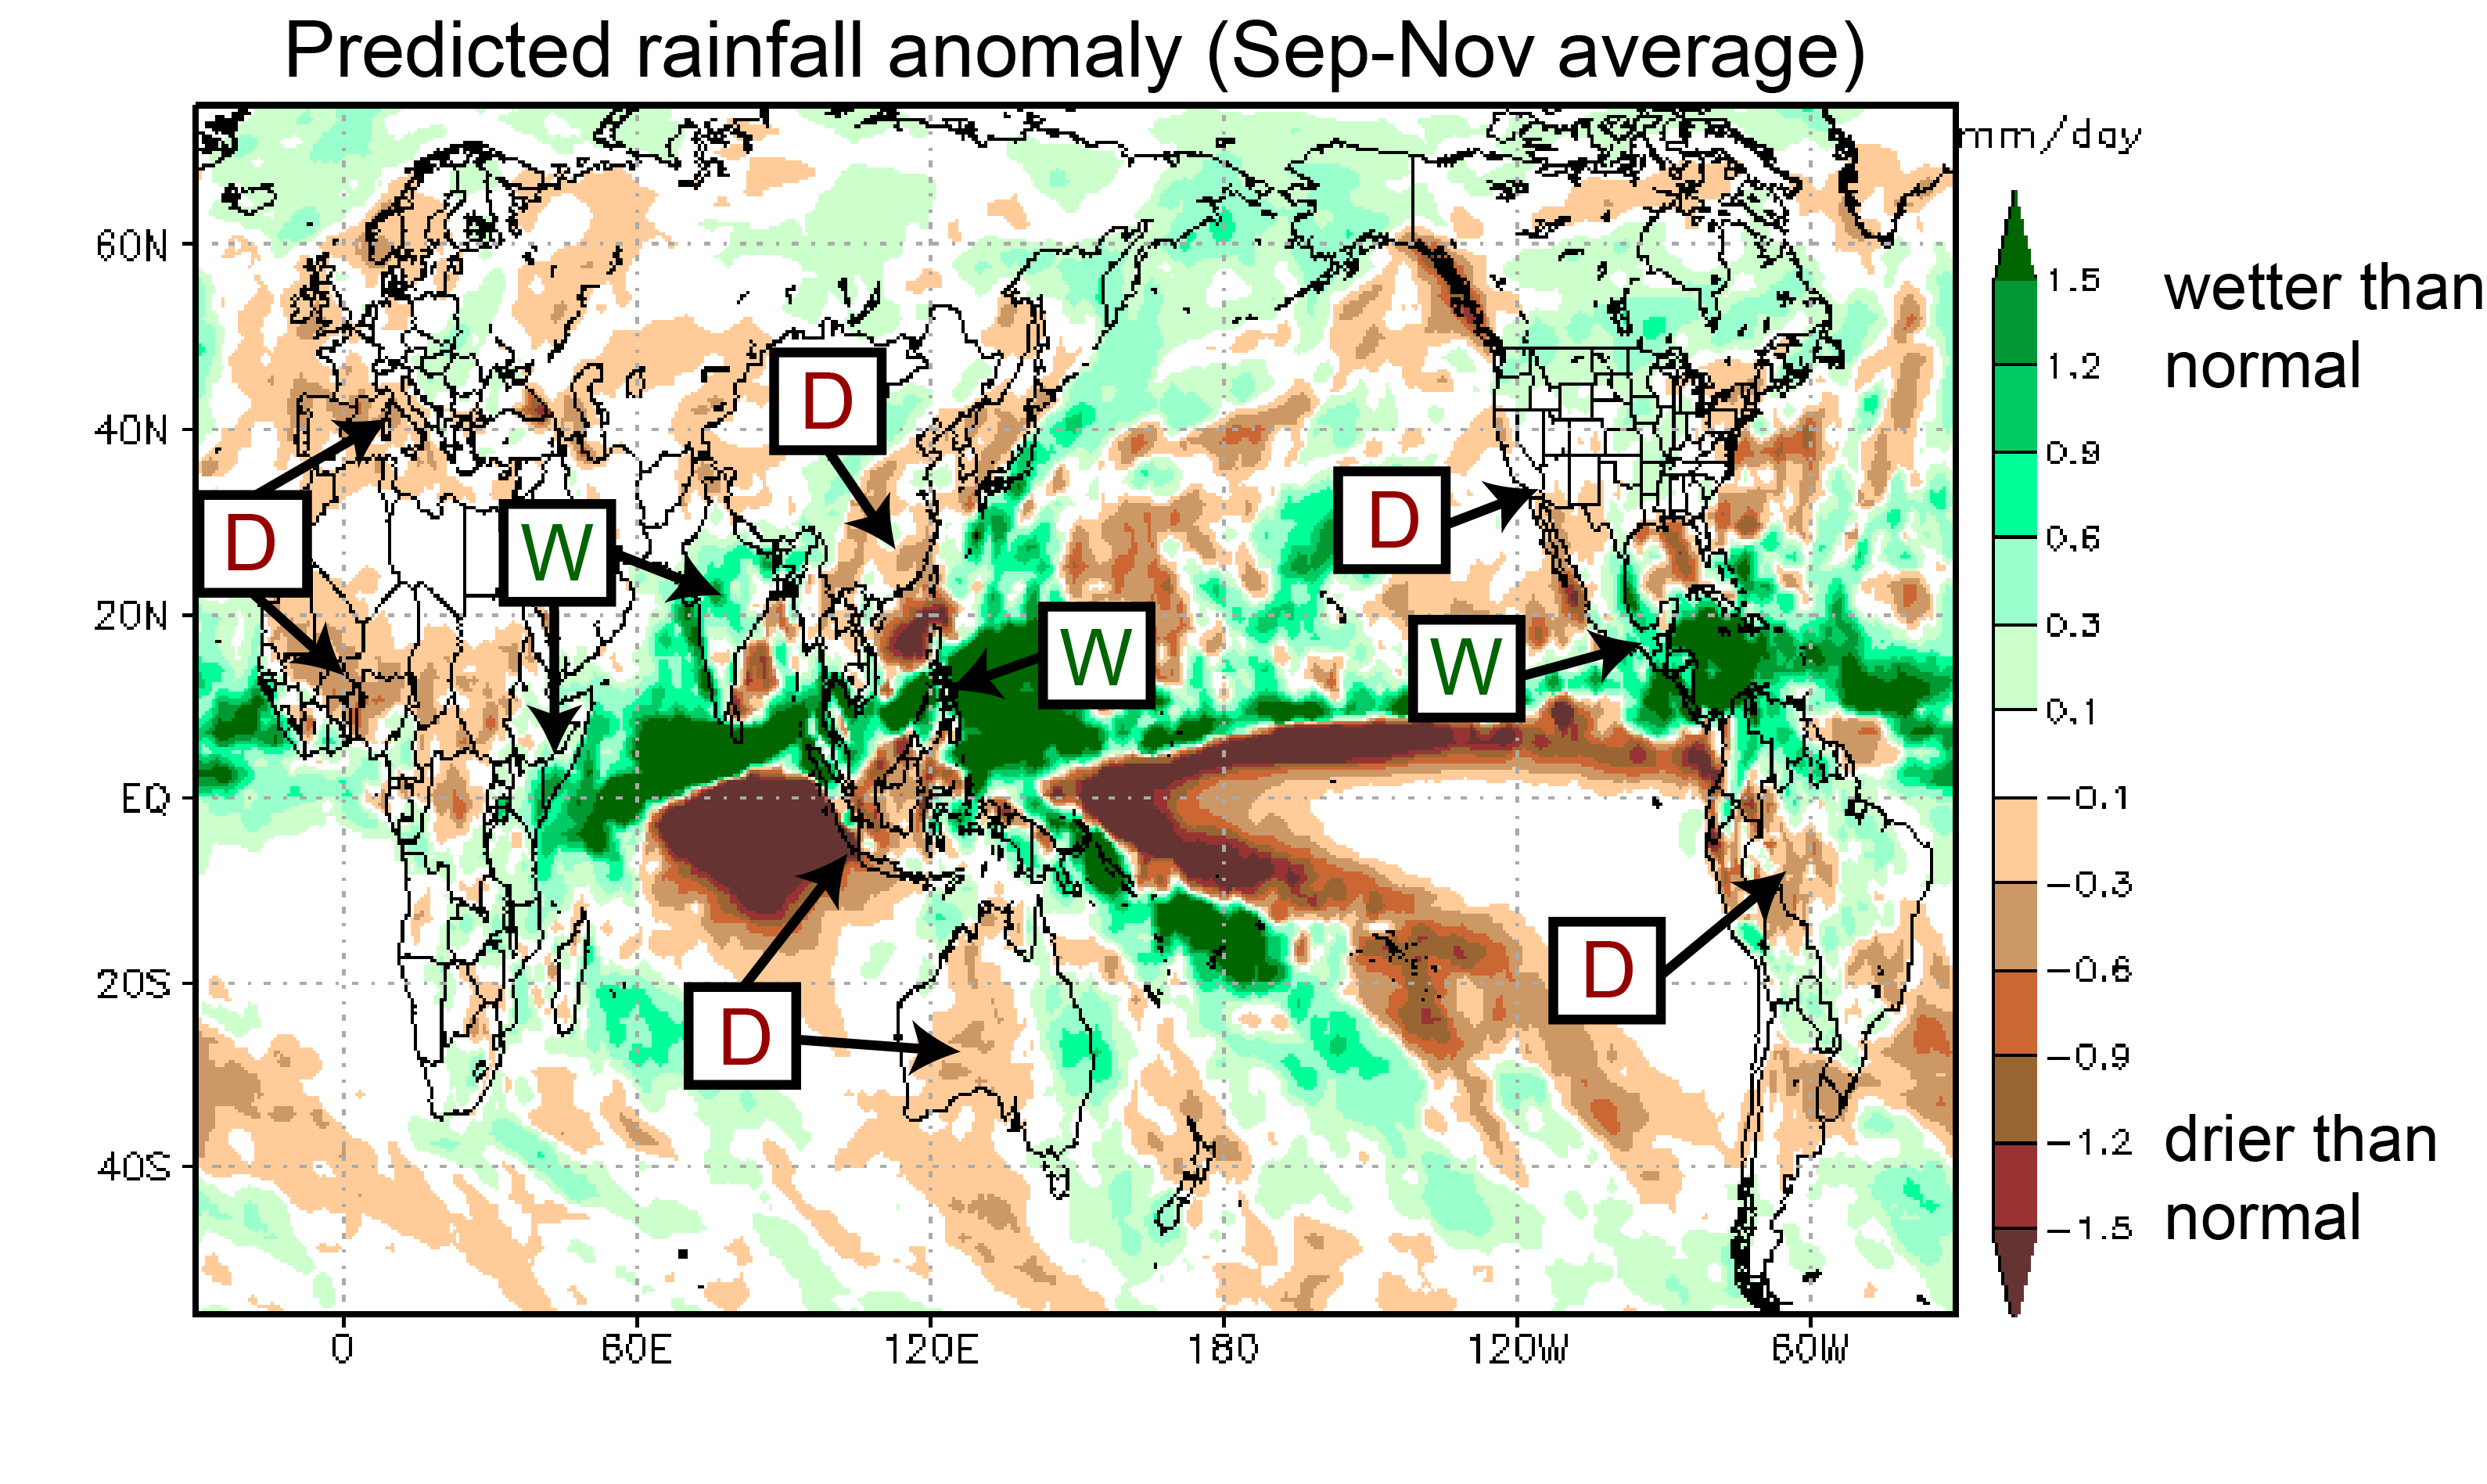
The imprint of La Niña can also be seen in the rainfall predictions for the central and eastern tropical Pacific, which show lower than average rainfall (Fig. 2), consistent with the cooler than average SST (Fig. 3). Over land, many areas are expected to see lower than average rainfall, including West Africa, Indonesia, and Australia, with the latter two related to the positive IOD in the Indian Ocean (Fig. 3).
For Japan, the model calls for a warmer and drier than average fall. Please bear in mind though that the model’s forecast skill in the mid and high latitudes is rather limited.
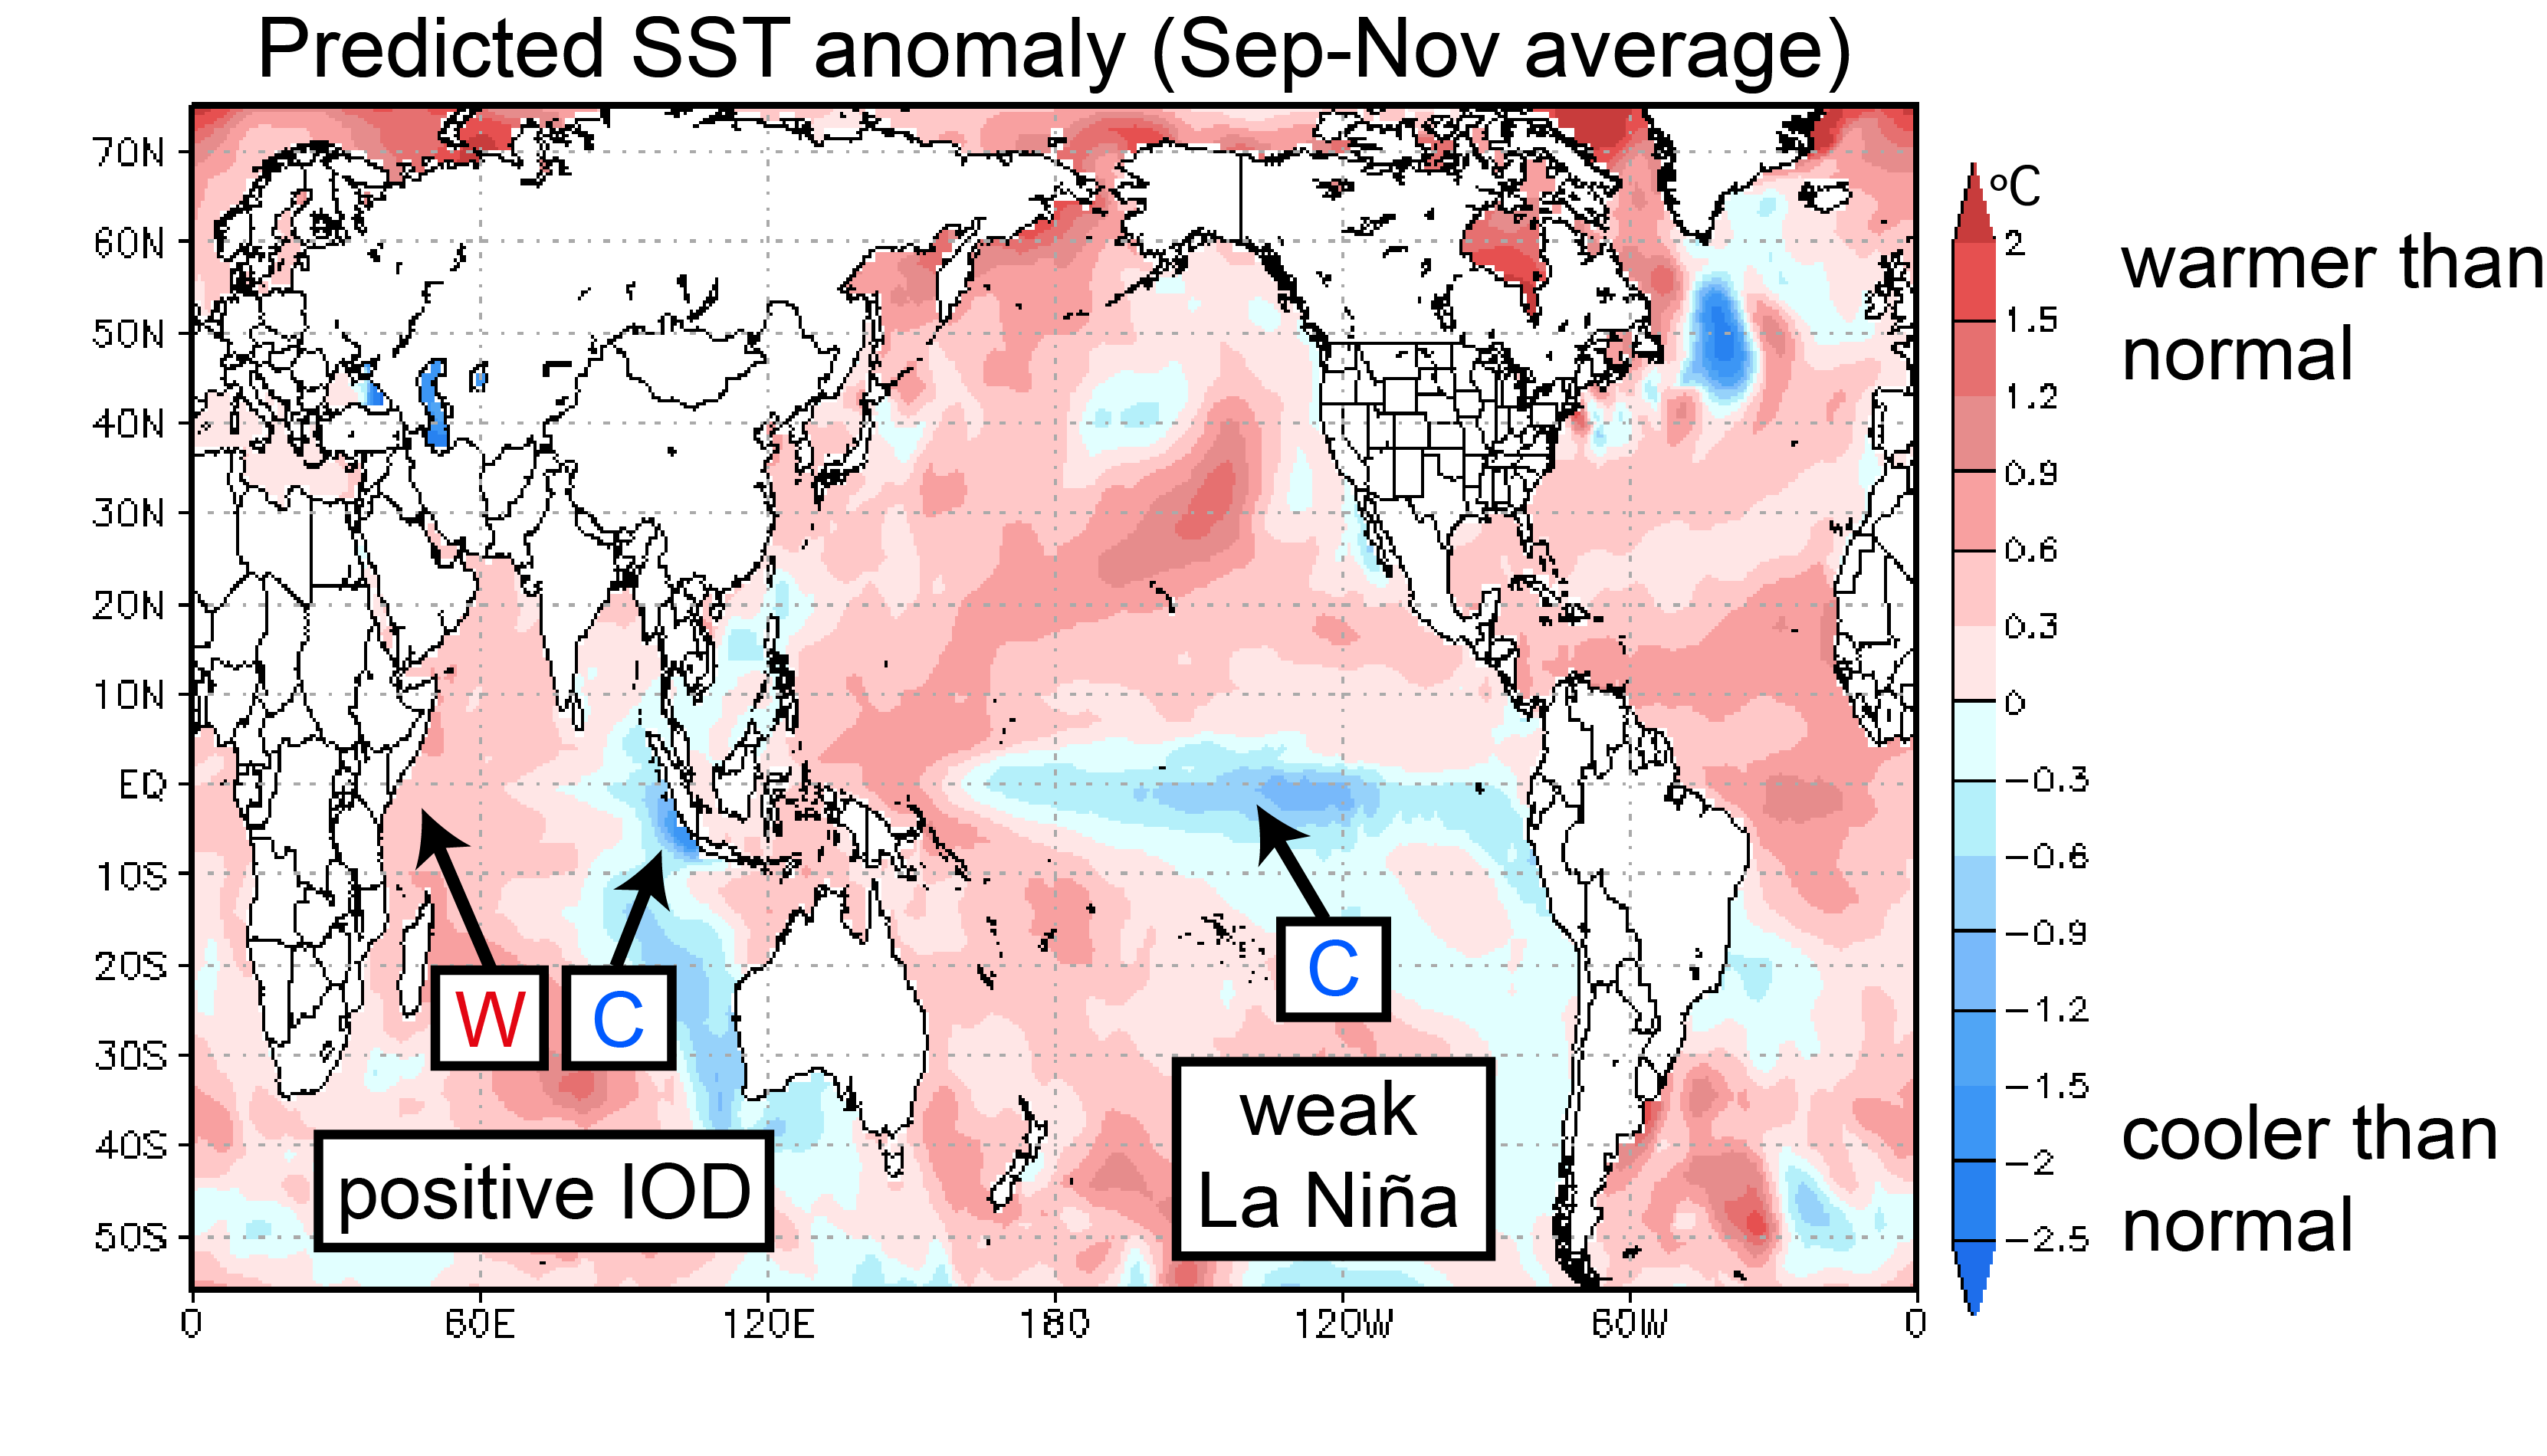
In addition to the La Niña-like conditions in the tropical Pacific, the SST prediction also suggests that the positive IOD will reach its peak in fall (Fig. 3).
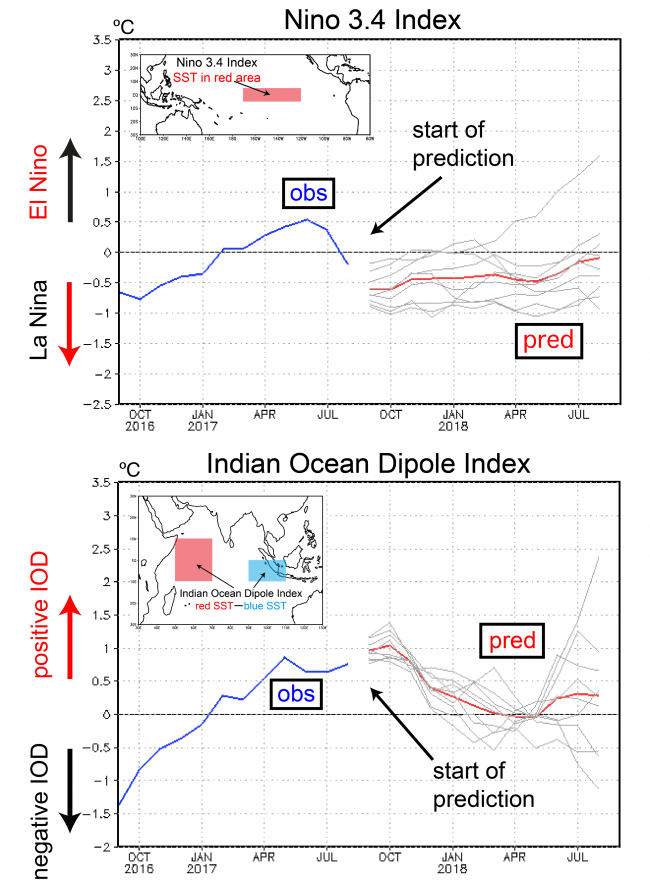
Figure 4 shows the extended forecast for two SST indices of interest. The Niño 3.4 index is predicted to be somewhat below average until spring of next year (red line in the upper panel of Fig. 4). This suggests weak La Niña conditions and is a significant change from last month’s forecast which called for neutral conditions. Several prediction centers around the world, including NOAA CPC, have also updated their outlooks and now see increased chances for La Niña this winter.
The IOD index suggests that the ongoing positive IOD event will increase slightly until October and gradually decay in the following months (Fig. 4, lower panel).