
Fall has come so it is time to assess the accuracy of our summer 2017 forecast.
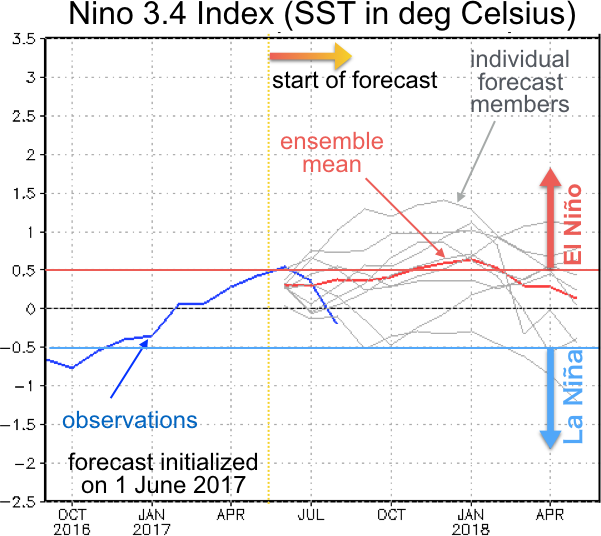
Let’s start with the tropical Pacific. Figure 1 shows the Niño 3.4 index, which is calculated by averaging sea-surface temperature (SST) anomalies over the eastern and central tropical Pacific. It is one of the most important indicators for the state of the El Niño-Southern Oscillation (ENSO). The blue line in Fig. 1 shows the observed Niño 3.4 index, which will be the reference for our forecast verification. La Niña-like conditions (the opposite phase of El Niño) were present in the fall of 2016 but gradually weakened thereafter, with approximately average conditions in February 2017 (actually that La Niña event is better characterized as La Niña Modoki; see our previous post for more on this). Temperatures continued to increase gradually in the following months and, in June, briefly touched the 0.5 ºC mark, which is considered the threshold for an El Niño event by many prediction centers (though usually SST should exceed this value for several months before an event is declared). An El Niño event, however, did not materialize because temperatures decreased in July and August, falling below 0.0 ºC in the latter month.
The SINTEX-F forecast initialized from 1 June 2017 (red line in Fig. 1) fares relatively well in the first two months but fails to capture the rapid drop in August. Overall, the fact that the model correctly predicted neutral conditions for the summer of 2017 can be considered a success.
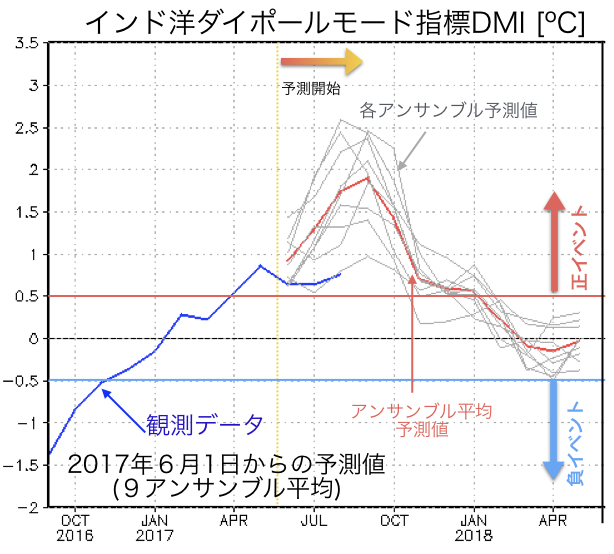
Next let’s take a look at the tropical Indian Ocean. The observations show that a positive Indian Ocean Dipole (IOD) in developed in spring and continued through August, with the IOD index exceeding +0.5 ºC (blue line in Fig. 2). The SINTEX-F prediction initialized on June 1 overestimated the development of the IOD by a factor of roughly 2 (red line in Fig. 2). Nevertheless, our model did capture the continuing IOD event. It is well known that the IOD is harder to predict than ENSO. Recent development of the SINTEX-F model has led to some improvement in IOD prediction (more info here [in Japanese]) but obviously there still is room for improvement.
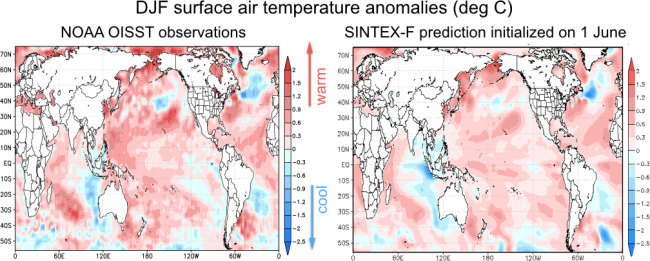
Next we take a global view in Fig. 3, which shows SSTs averaged from June through August for the NOAA OISST observations (left) and the SINTEX-F prediction initialized on June 1 (right). While the model does fairly well in the overall patterns, the overprediction of the IOD is evident by the excessive cooling in the eastern Indian Ocean. Also, the warm SST anomalies predicted in the Philippine Sea are weaker than observed.
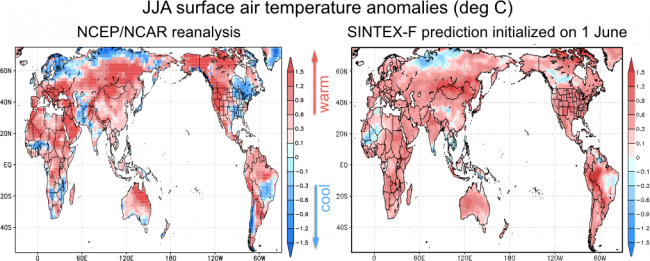
Surface air temperature predictions for the summer of 2017 are shown in Fig. 4. The left panel shows the surface air temperature anomalies in the NCEP/NCAR reanalysis (a product that combines observations and model simulation to obtain a best estimate of climate conditions), while the right panel shows the SINTEX-F predictions. Both are averaged from June through August. Since the model was initialized on 1 June, 2017, it had to predict temperatures 1 to 3 months ahead. By and large the prediction was successful but there are some regions where it was not, such as northern Europe, southern Africa, and eastern North America. Unfortunately, the Japanese Archipelago also belongs to that latter group.
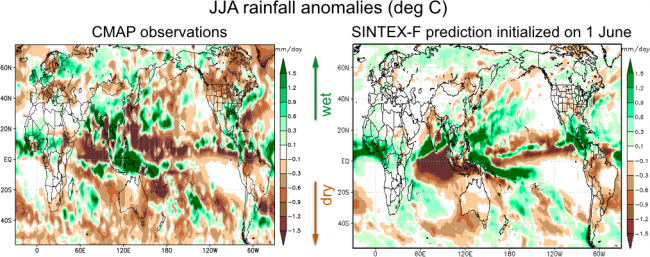
Finally, let’s take a look at the rainfall prediction for summer 2017 (averaged from June through August). The left panel of Fig. 5 shows the CMAP observations, while the right panel shows the SINTEX-F prediction initialized from June 1. For the tropical Pacific and Indian Ocean, the prediction agrees quite well with the observations. In particular the signature of the above-mentioned positive IOD, with decreased rain over the equatorial Indian Ocean, is well reproduced by the model. The model also correctly predicted drying over Java, Sumatra, Australia and northern Brazil. On the other hand, the drying over the Philippine Sea was not predicted by the model. The prediction also failed in many midlatitude areas, including Japan. Obviously, much work remains to be done.
This is our fifth forecast verification post. For researchers, forecast verification offers the opportunity to identify areas that are in need of further improvement. The comparison between forecast and observation forms the basis for predictability research and future improvement. The improvement of weather forecasts, which have become an indispensable part of our lives, was achieved through similar methods. We hope that, based on our forecast verification efforts, we will be able to gradually improve our model and provide an improved service to society.
APL is currently working on developing forecast products that can more easily be utilized by the end-user, such as prediction of crop yields and the prediction of the spread of infectious diseases. Results from these efforts can be seen at the web sites listed below. If you are interested, please take a look.
- Establishment of an early-warning system for infectious diseases in Southern Africa, incorporating climate predictions
- Australian winter wheat wield controlled by the Indian Ocean Dipole (Japanese only)
Finally, if you are interested in the latest forecasts, please follow this link.