
Spring has passed and we are entering into the rainy season. So it is time to assess the accuracy of our spring forecast.
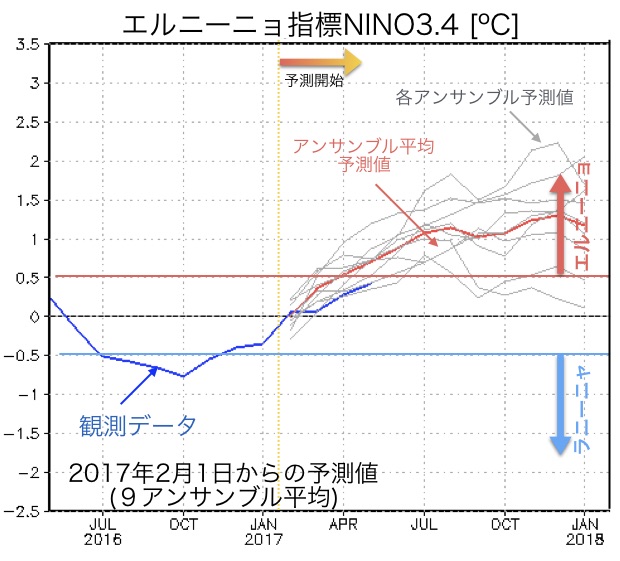
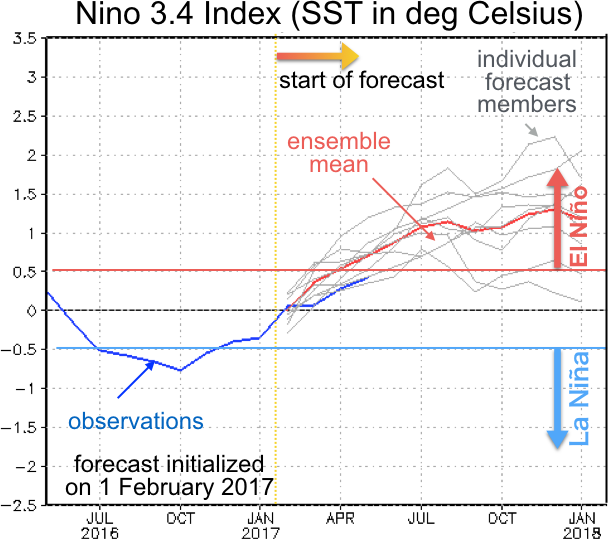
Let’s start with the tropical Pacific. Figure 1 shows the Niño 3.4 index, which is calculated by averaging sea-surface temperature (SST) anomalies over the eastern and central tropical Pacific. It is one of the most important indicators for the state of the El Niño-Southern Oscillation (ENSO). For an event to be categorized as El Niño this value should exceed 0.5 ºC (though different criteria exist). The blue line in Fig. 1 shows the Niño 3.4 index, as calculated from observations. This will be the reference for our forecast verification. The exceptionally strong El Niño that started in the latter half of 2015 lost steam in early 2016 and terminated in May. Temperatures in the region continued to drop and weak La Niña-like conditions (the opposite phase of El Niño) developed from July to September. In October, the event reached its peak and thereafter gradually decayed until temperatures returned to average conditions in February 2017. From there temperatures rose steadily and almost reached 0.5 ºC in May 2015. So if the warming continues over the next few months we will most likely see another El Niño. The red line in Fig. 1 shows the SINTEX-F forecast initialized from 1 February 2017. While this line is a bit above the blue line (observations) the general warming tendency is captured by the model.
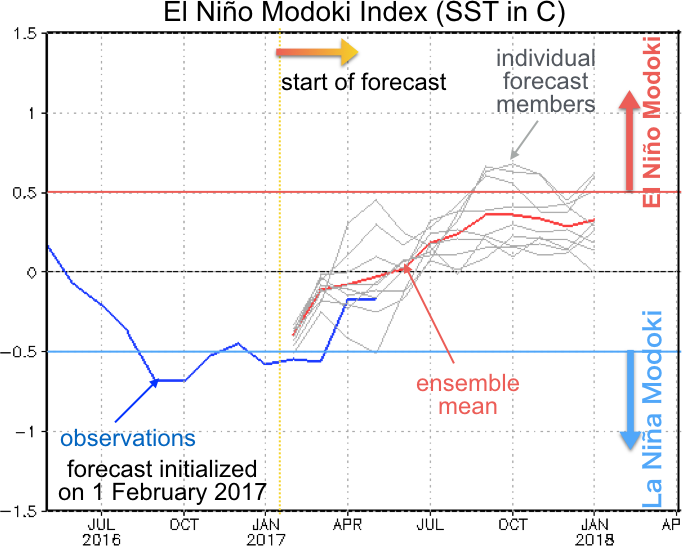
It was for a good reason that in the above we used the rather vague expression “La Niña-like conditions”. Only looking at the Niño 3.4 index hides the fact that this event is more typical of La Niña Modoki, where cool SST anomalies in the central equatorial Pacific are flanked by warm anomalies to the east and west. Looking at the El Niño Modoki Index (EMI; Fig. 2) reveals the tropical Pacific conditions from September 2016 to March 2017 can be described as a La Niña Modoki event. In April, this event terminated. The SINTEX-F model (initialized on February 1, 2017) predicts the event termination 1-2 months too early but is nevertheless in rough agreement with the observations.
A current APL research project funded by the Japanese Ministry of the Environment is working toward improving the prediction skill for phenomena like El Niño Modoki (grant number 2-1405: “Prediction of newly found climate phenomena and its societal application”, PI: Toshio Yamagata). I will probably write a post about the results of this project in the near future.
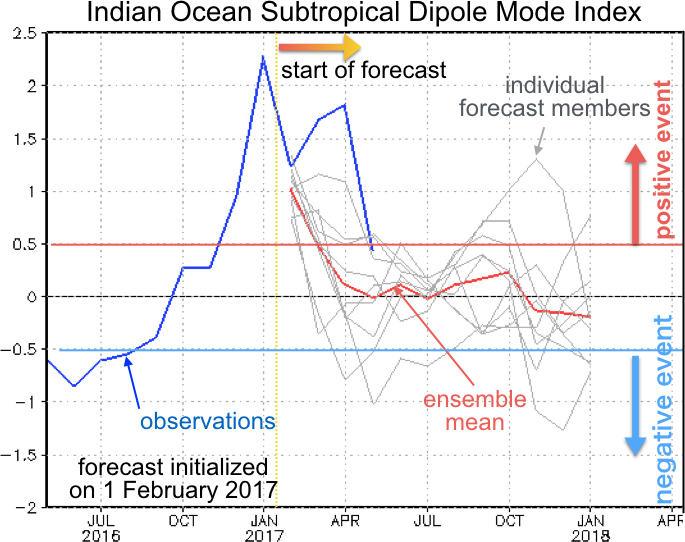
The southern Indian Ocean saw the development of an extremely strong positive subtropical dipole mode (IOSD) event. The positive phase of the IOSD has been linked to increased rainfall over southern Africa. Recently it has been pointed out that in order to predict malaria outbreaks in southern Africa (which are strongly linked to local rainfall and temperature) it is necessary to consider both El Niño and the IOSD (link to press release). The IOSD is often described using the Indian Ocean subtropical dipole mode index, or IOSDMI. This index (shown in Fig. 3) measures the east-west SST difference in the subtropical southern Indian Ocean. The event developed rapidly in December 2016 and January 2017, weakened in February, and rebounded to some extent in March and April before rapidly decaying in May. Unfortunately, the SINTEX-F prediction (initialized on February 1, 2017) completely failed to predict the secondary peak in March/April. This highlights the need to improve the skill of SINTEX-F in subtropical regions.
APL is currently involved in a project that aims to clarify the link between the IOSD and climate events in southern Africa (Prediction of Climate Variation and its Application in the Southern African Region). In the course of this project, we are also trying to improve the accuracy of our forecasts in the region.
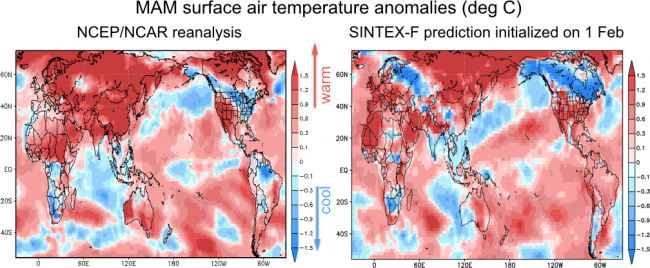
Finally, let’s check the surface air temperature predictions for the winter of 2016/2017 (Fig. 4). The left panel of Fig. 4 shows the surface air temperature anomalies in the NCEP/NCAR reanalysis (a product that combines observations and model simulation to obtain a best estimate of climate conditions), while the right panel shows the SINTEX-F predictions. Both are averaged from March through May. Since the model was initialized on 1 February, 2017, the model had to predict temperatures 2 to 4 months ahead. By and large the prediction was successful but there are some regions where it was not, such as western Australia, northern Brazil, and western Russia.
This is our fourth forecast verification post. For researchers, forecast verification offers the opportunity to identify areas that are in need of further improvement. The comparison between forecast and observation forms the basis for predictability research and future improvement. The improvement of weather forecasts, which have become an indispensable part of our lives, was achieved through similar methods. We hope that, based on our forecast verification efforts, we will be able to gradually improve our model and provide an improved service to society.
APL is currently working on developing forecast products that can more easily be utilized by the end-user, such as prediction of crop yields and the prediction of the spread of infectious diseases. Results from these efforts can be seen at the web sites listed below. If you are interested, please take a look.
- Establishment of an early-warning system for infectious diseases in Southern Africa, incorporating climate predictions
- Australian winter wheat wield controlled by the Indian Ocean Dipole (Japanese only)
Finally, if you are interested in the latest forecasts, please follow this link.