
This is the first in a series of posts I intend to write on current weather and climate related events in the tropical Atlantic. For some people, the first thing that comes to mind when hearing “tropical Atlantic” might be Atlantic hurricanes. While hurricanes may be mentioned here occasionally, my focus will not be hurricanes but climate variations that occur on time-scales of a few weeks to several years. Tropical Atlantic storms are already the topic of a number of blogs (e.g. Jeff Master’s WunderBlog, Hurricane Harbor, or Tropical Atlantic Headquarters). So what does the Atlantic have to offer, other than hurricanes? Here is my list, sorted by season:

So what are those animals? Following is a very brief description. I will explain these features in more detail in upcoming posts.
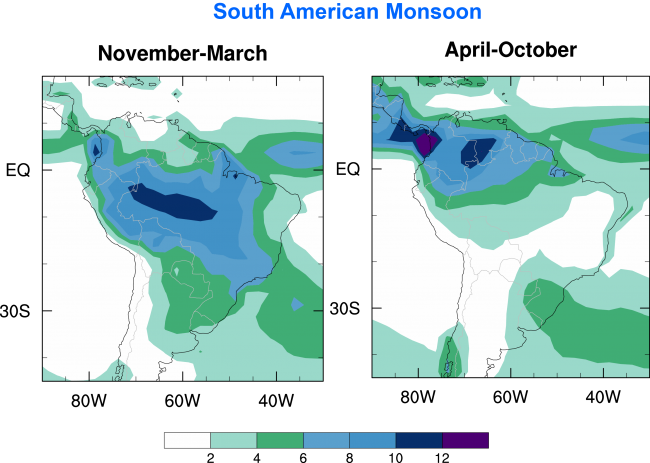
The South American summer monsoon (often called a monsoon system because it does not feature the seasonal wind reversal of the classic monsoon; Fig. 1 below) is marked by the seasonal occurrence of intense rainfall over South America, particularly Brazil, during southern-hemisphere summer (i.e. December-January-February). Year-to-year changes in monsoon intensity can lead to droughts or floods with significant socio-economic impacts.
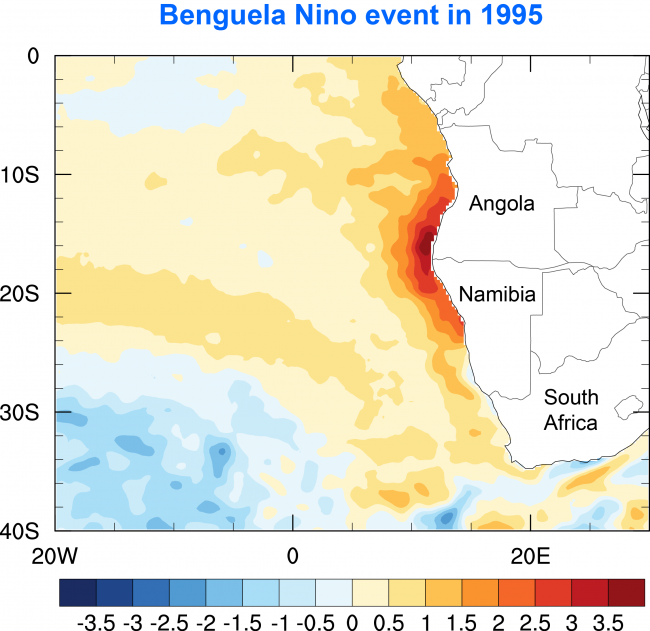
The Benguela Niño (Fig. 2 below) is a phenomenon (also called climate mode) that occurs along the coast of southwestern Africa, particularly affecting South Africa and Namibia. This coastal region is marked by upward flow of cold nutrient-rich waters from depth that support a rich marine ecosystem. In certain years the upward flow stalls, leading to unusually (or anomalously) warm surface waters that are poor in nutrients and can lead to the collapse of fisheries.
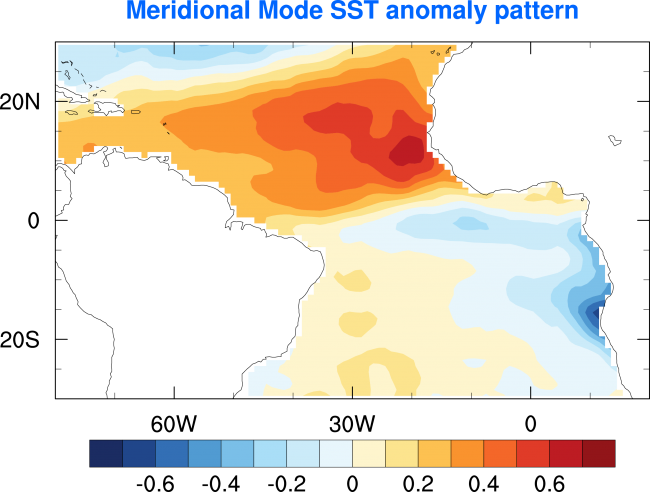
The Atlantic meridional mode (Fig. 3 below) is pattern of unusual sea-surface temperatures (SSTs) in the northern and southern subtropical Atlantic (the term mode refers to a spatial pattern of unusual conditions that recurs at irregular intervals). In its positive phase SSTs are unusually warm north of the equator and unusually cool to the south. This pattern leads to reduced rainfall over South America and increased rainfall over Northwest Africa. The opposite occurs during the negative phase. The meridional mode changes on time scales of several years and longer.
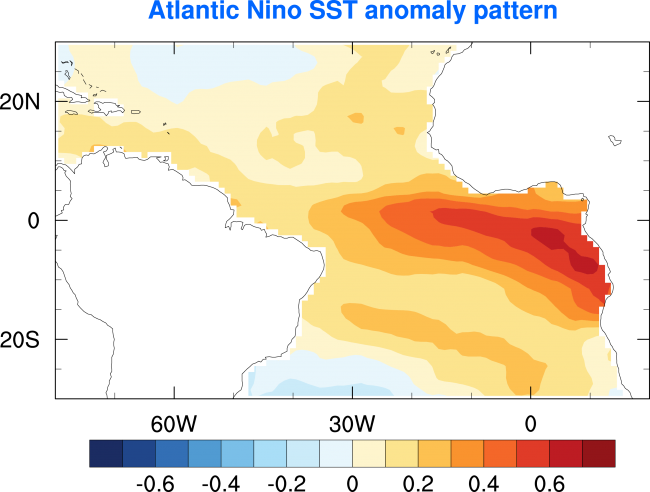
Atlantic Niños (Fig. 4 below) are the positive phase of the Atlantic zonal mode, with the negative phase being called Atlantic Niña. You probably have at least heard of El Niño, the tropical Pacific climate event. Well, in some sense, the Atlantic Niño is the little brother of El Niño. Every few years the temperatures in the eastern equatorial Atlantic become unusually warm. This has impacts on the rainfall over South America and tropical Africa. Some researchers even suggest that the Atlantic Niño may give the big brother a kick in the behind once in a while to make it change its course.
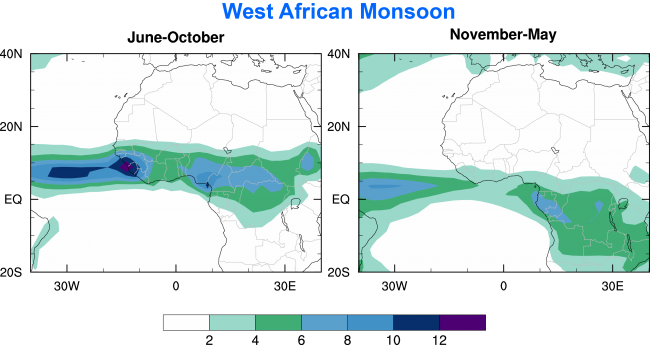
Finally, the West African monsoon (Fig. 5 below) relates to the seasonal rains occurring in Northwest Africa in summer and fall. The Sahel region, located south of the Sahara Desert, is highly dependent on the monsoon rains for its agriculture. The 2010 drought and subsequent famine in the region is just one example of the havoc climate variability in the region can wreak.
The Atlantic posts will focus on the above topics but not be limited to them. Other topics I might want to write about are influences from outside the tropics (e.g. the North Atlantic Oscillation, the Southern Ocean), influences from the tropical Pacific, global warming, and, yes, Atlantic hurricanes.
My intent is to make these posts informative for both the general public and climate scientists. Let’s see where this goes.