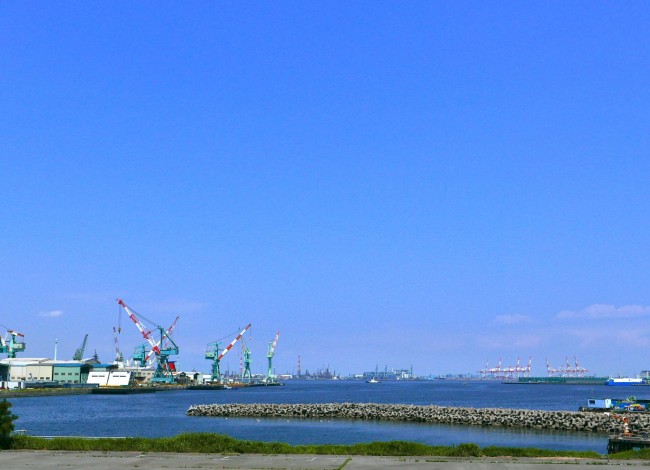
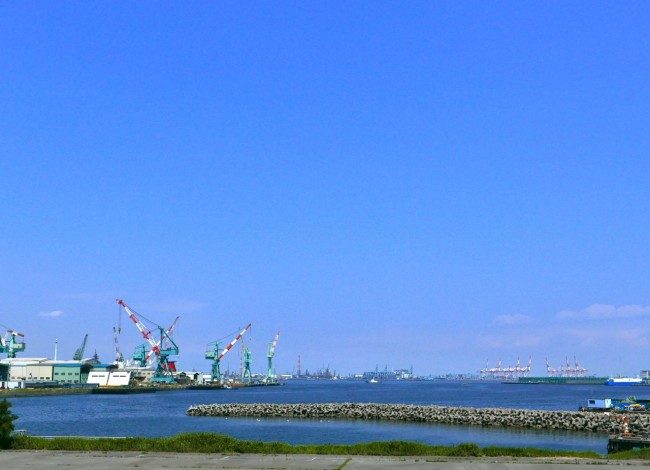
Hi there! What did everybody do for Marine Day?1 The picture above shows the ocean closest to the Yokohama Campus. Even though this is in the heavily industrialized Tokyo Bay the colors of the sky and ocean are quite pretty, right?
The Japan Meteorological Agency (JMA) has declared that the rainy season is over in western Japan (from Kyushu to the Tokai region) and so the real summer has started there (see here for the Japanese announcement). According to the SINTEX-F model both the remainder of the summer and the following fall will be warmer than usual in many parts of the world. Additionally, the tropical Pacific Ocean will feature neutral or weak La Niña conditions, while in the tropical Indian Ocean the negative Indian Ocean Dipole (IOD) will strengthen. These conditions will influence precipitation in many regions, as discussed below.
Air temperature and rain for the period September through November
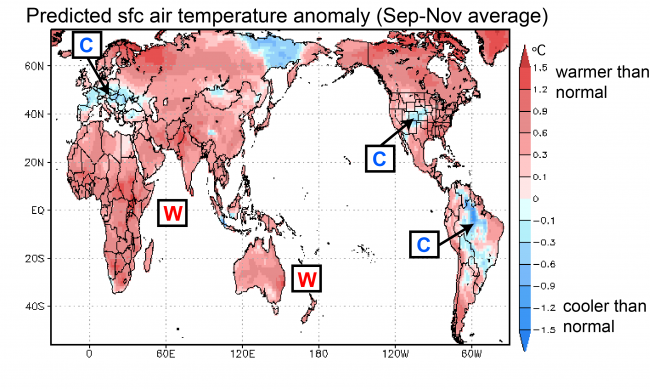
Warmer than average temperatures are expected in many areas of the world (Fig. 1). Exceptions are the central US, western Brazil, and central Europe.
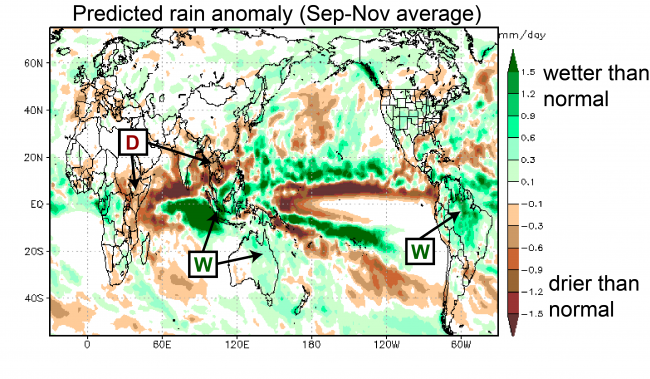
Lower than average precipitation is expected over East Africa and Mainland Southeast Asia, while above average precipitation is expected over Indonesia, Australia, and northern South America.
As for Japan, the period September through November is forecast to be warmer than usual. Above average rainfall is forecast to occur in western Japan during August and in northern Japan during October. However, since the forecast accuracy is limited for this region, the predictions should be taken with a grain of salt.
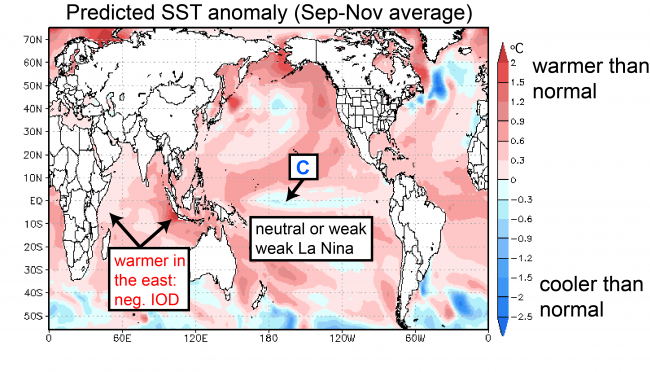
Ocean temperatures for the period September through November
In difference to daily weather fluctuations, seasonal climate variations are strongly influenced by changes in sea-surface temperatures (SSTs). Particularly in the tropics, where the SSTs are warmer than in other regions, even small changes in temperature can produce far reaching effects.
In the tropical Pacific, the powerful El Niño of 2015/2016 has decayed and conditions in July were close to neutral (according to NOAA/PSD observations).
According to the SINTEX-F predictions, the tropical Pacific in fall will be marked by neutral or weak La Niña conditions (Fig. 3). This is a big change from last month’s prediction, which called for a moderate to strong La Niña event to develop. A look at ocean temperatures down to 200m (NCEP/CPC) suggests that temperatures are significantly lower than average over the whole equatorial Pacific. SINTEX-F, however, only uses surface temperatures to initialize its predictions and so the model did not know about the cool temperatures lurking below the surface. This is why the outlook for La Niña should be used with caution. On the other hand, we would like to point out that even prediction centers that do use subsurface observations to initialize their models are starting to back away from their confident La Niña predictions.
In the Indian Ocean, negative IOD conditions currently prevail, with warmer than average SSTs in the east and close-to-average SSTs in the west. The IOD is expected to strengthen in fall and this likely contributes to the forecast of drier than normal conditions over East Africa and mainland Southeast Asia.
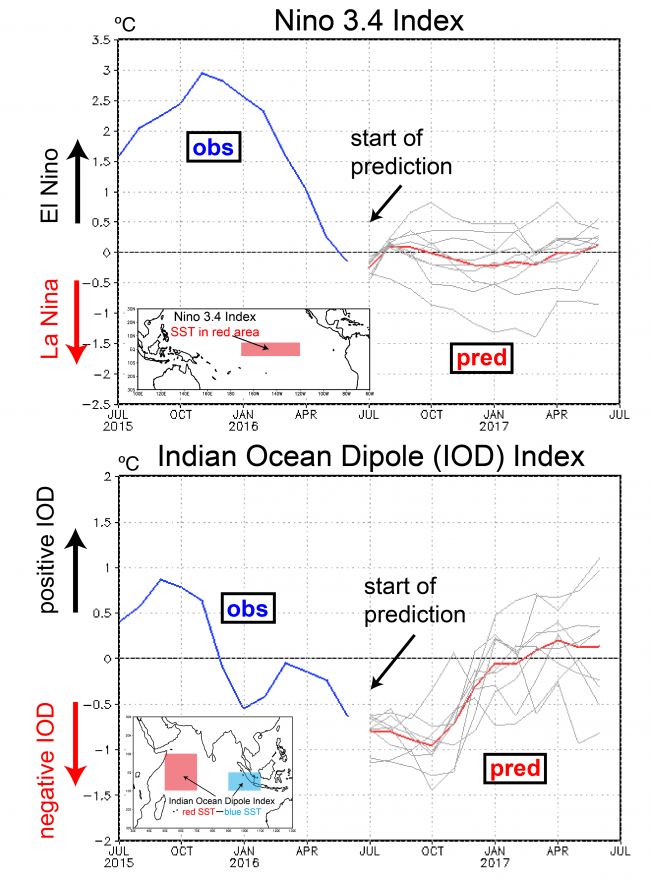
Finally, let’s look at how conditions in the tropics will develop over the coming 12-month period. Figure 4 shows two indices that characterize La Niña and the IOD. The Niño 3.4 index is predicted to dip below 0ºC starting from October, with neutral or weak La Niña conditions for the rest of the year.
The IOD index is predicted to stay below -0.5 ºC from July through November, which suggests that negative IOD conditions will continue. From December onward, the negative IOD will gradually decay.
It will be interesting to observe how the combination of a weak La Niña and a moderate negative IOD will influence climate across the globe in the coming months.
1 translator’s note: Marine Day is a Japanese national holiday on the third Monday of July.