
The cold of winter is gradually easing up and spring seems to be just around the corner. So in this post we will check how our winter forecast fared.
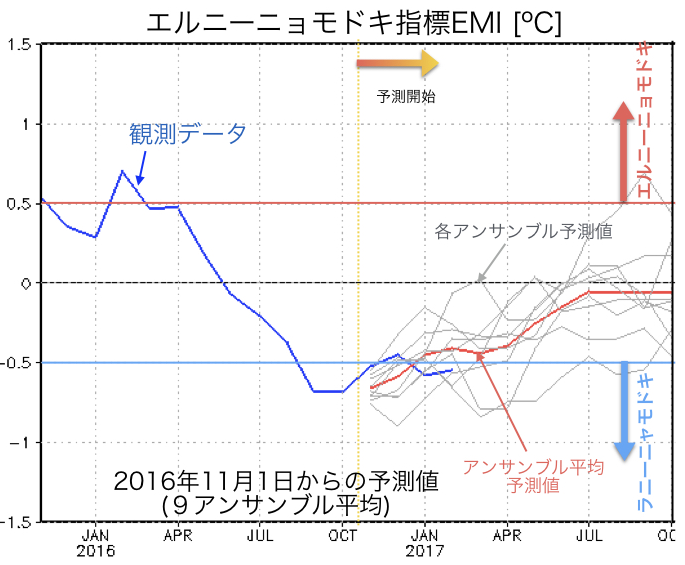
Let’s start with the tropical Pacific. Figure 1 shows the Niño 3.4 index, which is calculated by averaging sea-surface temperature (SST) anomalies over the eastern and central tropical Pacific. It is one of the most important indicators for the state of the El Niño-Southern Oscillation (ENSO). The blue line shows the Niño 3.4 index, as calculated from observations, up to February 2017. This will be the reference for our forecast verification. From the end of 2015, El Niño started weakening and eventually terminated in May of 2016. Temperatures in the region continued to drop and weak La Niña-like conditions (the opposite phase of El Niño) developed from July to September. In October, the event reached its peak and thereafter gradually decayed until temperatures returned to average conditions in February 2017. The red line shows the SINTEX-F forecast initialized from 1 November 2016. There is good agreement between the prediction and the observations until January. In February, however, the model predicted an anomaly of -0.5 ºC, while in the observations the cool anomaly reduced to 0 ºC (i.e. average temperatures). Thus the observed sudden increase in SST is not captured by the model.
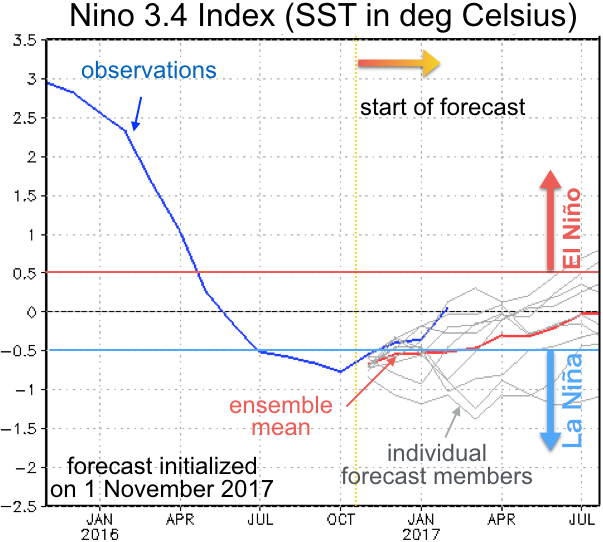
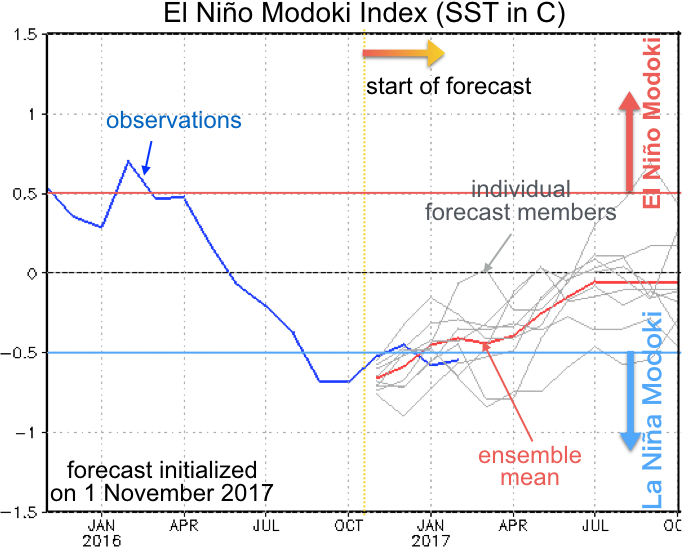
It was for a good reason that in the above we used the rather vague expression “La Niña-like conditions”. Only looking at the Niño 3.4 index hides the fact that this event is more typical of La Niña Modoki, where cool SST anomalies in the central equatorial Pacific are flanked by warm anomalies to the east and west. Looking at the El Niño Modoki Index (EMI; Fig. 2) confirms that the tropical Pacific condition from September 2016 to February 2017 does indeed qualify as a La Niña Modoki event. The SINTEX-F prediction tracks the observations relatively well.
A current APL research project funded by the Japanese Ministry of the Environment is working toward improving the prediction skill for phenomena like El Niño Modoki (grant number 2-1405: “Prediction of newly found climate phenomena and its societal application”, PI: Toshio Yamagata). I will probably write a post about the results of this project in the near future.
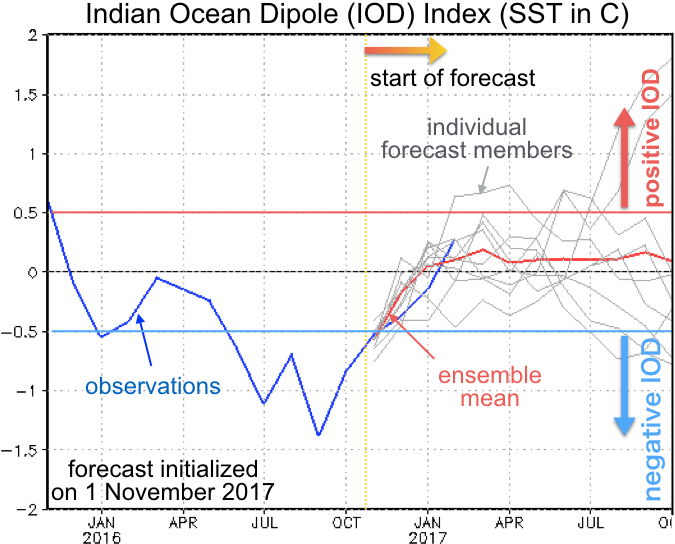
Next we take a look at the tropical Indian Ocean. The observations show that a negative Indian Ocean Dipole (IOD) event developed rapidly in June and July, with the IOD index reaching -1 ºC. From then until October, the index kept hovering around -1 ºC but rapidly decayed thereafter. The SINTEX-F prediction initialized on November 1 captured the observed decline of the event rather successfully (Fig. 3).
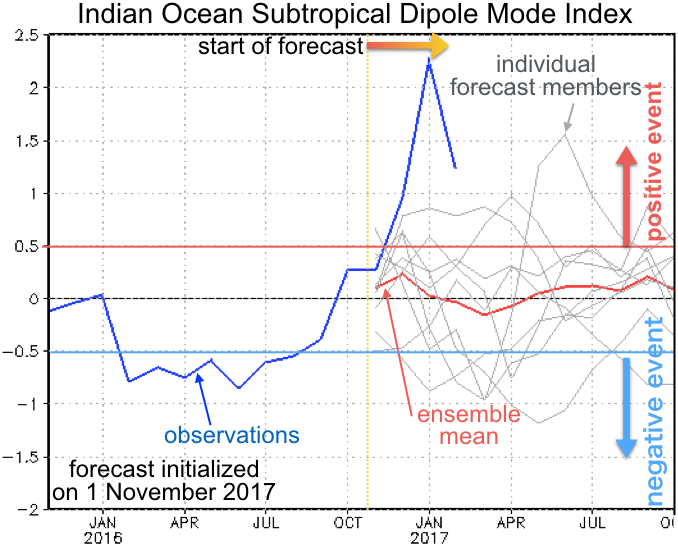
In addition to the IOD event, the Indian Ocean also saw the development of an extremely strong positive subtropical dipole mode (IOSD) event. The positive phase of the IOSD has been linked to increased rainfall over southern Africa. The IOSD is often described using another index, called the Indian Ocean subtropical dipole mode index, or IOSDMI. This index (shown in Fig. 4) measures the east-west SST difference in the subtropical southern Indian Ocean. The event developed rapidly in December 2016 and January 2017, and equally rapidly weakened in February. The SINTEX-F prediction initialized on November 1, 2016, completely failed to predict the rapid development in December/January. This highlights the need to improve the skill of SINTEX-F in subtropical regions.
APL is currently involved in a project that aims to clarify the link between the IOSD and climate events in southern Africa (Prediction of Climate Variation and its Application in the Southern African Region). In the course of this project, we are also trying to improve the accuracy of our forecasts in the region. At some point, we would like to report on the progress of this project as well.
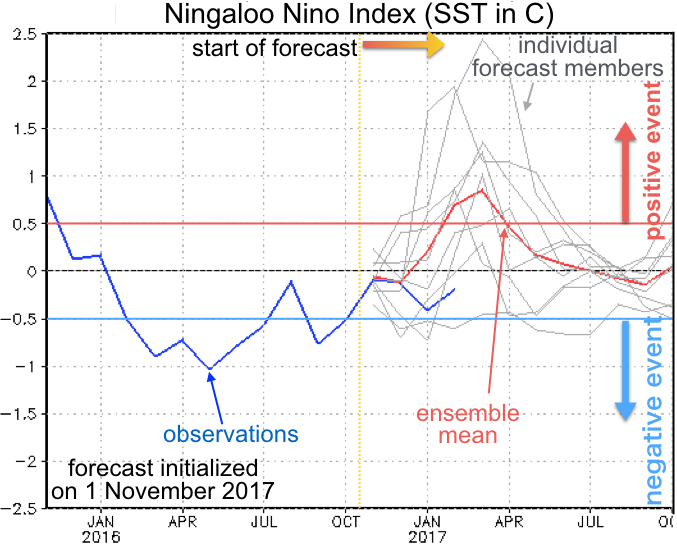
Next we look at the Ningaloo Niño, which is a mode of climate variability that occurs off the coast of western Australia and is associated with rainfall anomalies in the region. The Ningaloo Niño Index (NNI) measures SST averaged along the coast of western Australia and is shown in Fig. 5. SINTEX-F predicted strong warming in the region (red line in Fig. 5; prediction initialized on November 1, 2016) but looking at the observations (blue line in Fig. 5) it becomes clear that this event failed to materialize. This kind of regional event continues to be difficult to predict and more effort will be needed to improve SINTEX-F’s forecast skill in this regard. The above mentioned research effort (Prediction of newly found climate phenomena and its societal application) also includes the Ningaloo Niño.
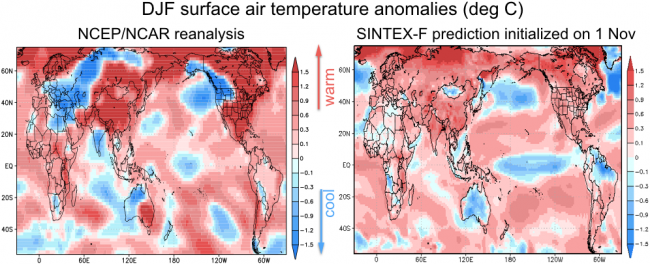
Finally, let’s check the surface air temperature predictions for the winter of 2016/2017 (Fig. 6). The left panel of Fig. 6 shows the surface air temperature anomalies in the NCEP/NCAR reanalysis (a product that combines observations and model simulation to obtain a best estimate of the actual climate conditions), while the right panel shows the SINTEX-F predictions. Both are averaged from December through February. Since the model was initialized on 1 November, 2016, it had to predict temperatures 2 to 4 months ahead. The observations (or rather reanalysis) show a clear tripole structure in the tropical Pacific, with cool temperature anomalies in the center flanked by warm anomalies to the west and east. The model correctly predicted the conditions in the western and central Pacific, but failed to produce the warm anomalies in the east. Over land, the model correctly predicted warmer than average temperatures in places like Asia, the eastern and central parts of North America, northern Europe, and central Africa. It also succeeded in predicting the cooler than average summer in western Australia. On the other hand, the model failed in several regions, including southern and central Europe, the Middle East, India, eastern Australia, and northern Brazil.
This is already our third post on forecast verification. For researchers, forecast verification offers the opportunity to identify areas that are in need of further improvement. The comparison between forecast and observation forms the basis for predictability research and future development. The improvement of weather forecasts, which have become an indispensable part of our lives, was achieved through similar methods. We hope that, based on our forecast verification efforts, we will be able to gradually improve our model and provide an improved service to society.
APL is currently working on developing forecast products that can more easily be utilized by the end-user, such as prediction of crop yields and the prediction of the spread of infectious diseases. Results from these efforts can be seen at the web sites listed below. If you are interested, please take a look.
- Establishment of an early-warning system for infectious diseases in Southern Africa, incorporating climate predictions
- Australian winter wheat wield controlled by the Indian Ocean Dipole (Japanese only)
Finally, if you are interested in the latest forecasts, please follow this link.