

Japan’s rainy season has started and hydrangea are flowering left and right. Rain in the Kanto region, however, is still a bit on the weak side, so JAMSTEC’s hydrangea are eagerly awaiting some H2O, preferably in its liquid form (after all, the “hydr” in hydrangea comes from the Greek word “hydro”, which means water). Speaking of rain, what’s the climate outlook for this summer? According to the SINTEX-F seasonal prediction, most areas around the world will experience warmer than usual summer temperatures. In the tropical Pacific, La Niña will establish itself, while in the Indian Ocean a negative dipole event will develop. It appears that these two climate modes will affect rainfall in many regions. Let’s have a closer look.
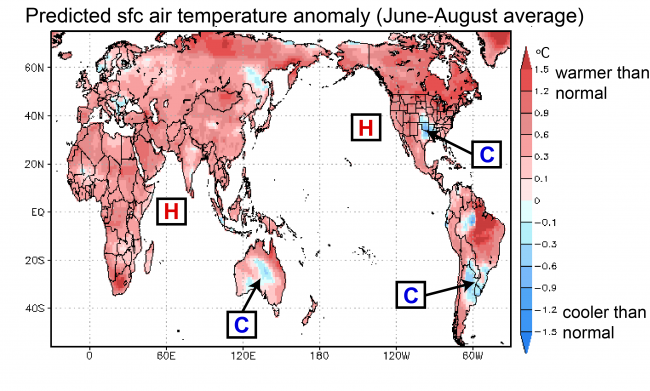
The predictions haven’t changed much from those presented in last month’s post. Warmer than average temperatures are expected pretty much everywhere on the globe (Fig. 1). Exceptions are the Southeastern US, southern South America, and central Australia. These cooler than normal areas have shifted somewhat compared to the last forecast.
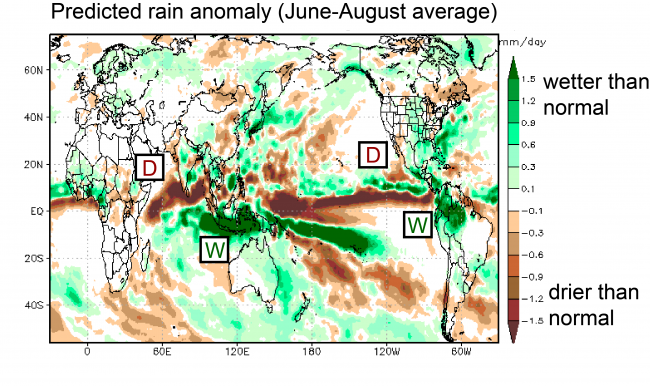
As for precipitation, SINTEX-F predicts lower than average rainfall over East Africa, the western Indian Ocean, and the subtropical Pacific off the Mexican coast (Fig. 2). Indonesia, Australia and northern South America, on the other hand, will see higher than normal rainfall. These predictions generally agree with those of last month but the positive rainfall anomalies over Indonesia and northern South America are now more intense.
As for the summer in Japan, the forecast calls for both temperature and rainfall to be above normal. In July, convective activity over the Philippines will pick up while the Ogasawara high (a high pressure system over the subtropical Northwest Pacific; also called Bonin high) will establish itself. It appears that this configuration will cause the Baiu/Mei-yu front to linger over Japan. In August, moisture laden air south of Japan will flow along the western flank of the Ogasawara high into Japan, which may lead to higher than normal rainfall. In July and August, Japan will be under the combined influence of the Ogasawara high and the Tibetan high. This should lead to rather stable high pressure over Japan, which favors heat waves.
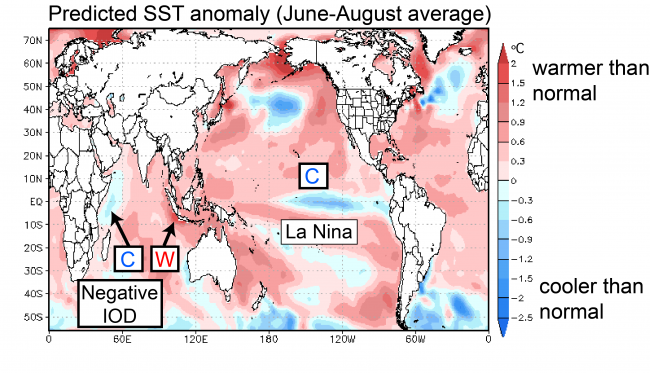
To get a better understanding of the rationale behind the summer prediction let’s look at the sea-surface temperatures (SSTs), which have a crucial influence on climate variations. Due to the 2015/2016 El Niño SSTs in the central and eastern tropical Pacific were much warmer than average but in recent months have been close to normal. According to the SINTEX-F prediction, SSTs in the tropical eastern Pacific will gradually become cooler than normal in the following months (Fig. 3) and evolve into a full-fledged La Niña event toward the end of the year, with the western Pacific warmer than usual and the eastern Pacific cooler than usual.
In the Indian Ocean, on the other hand, SSTs were warmer than usual in the entire basin from March through May. In June, however, SSTs in the east started warming while SSTs in the west started cooling (according to NOAA/PSD observations). This condition is known as the negative phase of the Indian Ocean Dipole and is expected to strengthen over the coming months. As a result, rainfall is likely to increase over the western Indian Ocean and decrease over the east.
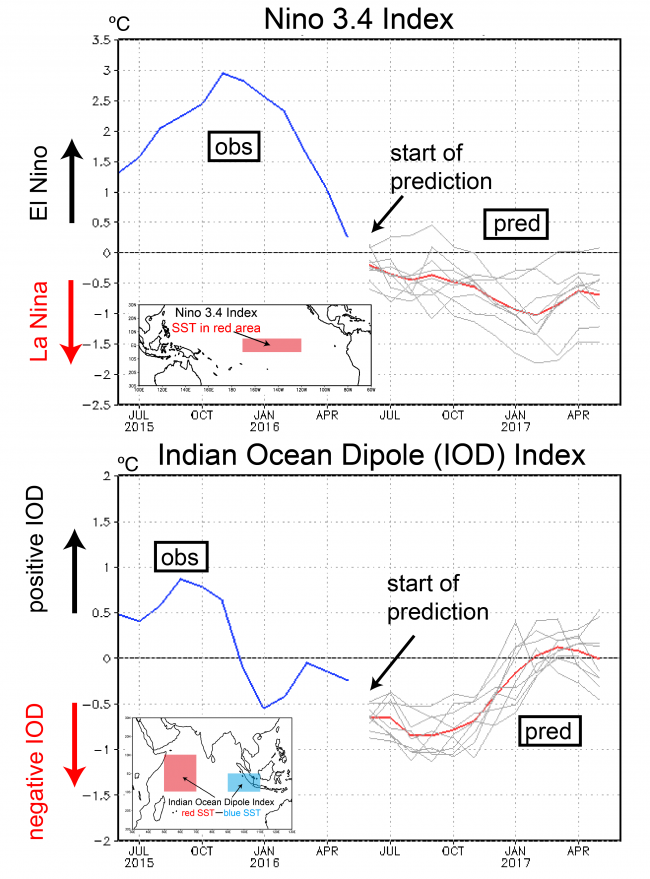
So what is the extended outlook for both La Niña and the negative Indian Ocean Dipole? Figure 4 shows the predicted evolution of SST anomalies in the regions where the two phenomena are most clearly expressed. The predicted ensemble mean Niño 3.4 index (red line in Fig. 4) shows temperatures below -0.5 C starting from October, with La Niña gradually strengthening toward the end of the year and lasting into the spring of 2017.
The Indian Ocean dipole index, on the other hand, is predicted to stay below -0.5 C from June through November. Thereafter it will weaken rapidly.
So how certain are these predictions, particularly those for Japan? Both La Niña and a negative Indian Ocean Dipole are currently developing. Both phenomena have worldwide climate impacts but, in the case of Japan, their effects tend to pull in opposite directions: while La Niña promotes summer heat waves, a negative Indian Ocean Dipole tends to bring cool summers to Japan. Because of these competing effects predicting this year’s Japanese summer is a tricky business, and it would be wise to keep a close watch on how conditions evolve over the coming weeks. This is certainly what we’ll be doing.